- Home >
- Stock Photos >
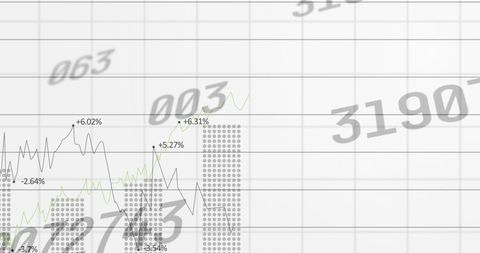
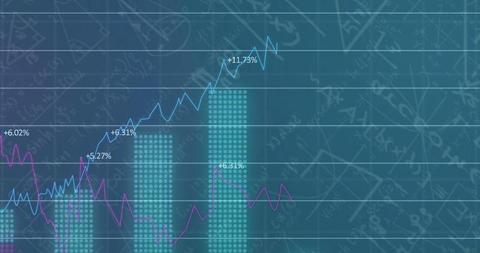
- Financial Numbers and Graphs on Blue Background
Financial Numbers and Graphs on Blue Background Image

Depicts digital representation of financial data with numbers and line graphs on a blue grid-like background. Useful for illustrating concepts related to finance, economy, and technology trends. Ideal for articles or presentations on economic analysis, stock market performance, or financial services. Can also be used in corporate digital communication showcasing data analytics.
Powered by  - Get 15% off with code: PIKWIZARD15


2
downloads
downloads
Tags:
More
Credit Photo
If you would like to credit the Photo, here are some ways you can do so
Text Link
photo Link
<span class="text-link">
<span>
<a target="_blank" href=https://pikwizard.com/photo/financial-numbers-and-graphs-on-blue-background/86226cda0d9e9b92402712f87db8fcea/>PikWizard</a>
</span>
</span>
<span class="image-link">
<span
style="margin: 0 0 20px 0; display: inline-block; vertical-align: middle; width: 100%;"
>
<a
target="_blank"
href="https://pikwizard.com/photo/financial-numbers-and-graphs-on-blue-background/86226cda0d9e9b92402712f87db8fcea/"
style="text-decoration: none; font-size: 10px; margin: 0;"
>
<img src="https://pikwizard.com/pw/medium/86226cda0d9e9b92402712f87db8fcea.jpg" style="margin: 0; width: 100%;" alt="" />
<p style="font-size: 12px; margin: 0;">PikWizard</p>
</a>
</span>
</span>
Free (free of charge)
Free for personal and commercial use.
Author: People Creations
Similar Free Stock Images

Premium


Premium


Premium


Premium


Premium


Premium


Premium


Premium


Premium


Premium


Premium


Premium


Premium


Premium


Premium


Premium


Premium


Premium


Premium


Premium


Premium


Premium


Premium


Premium


Premium