- Home >
- Stock Photos >
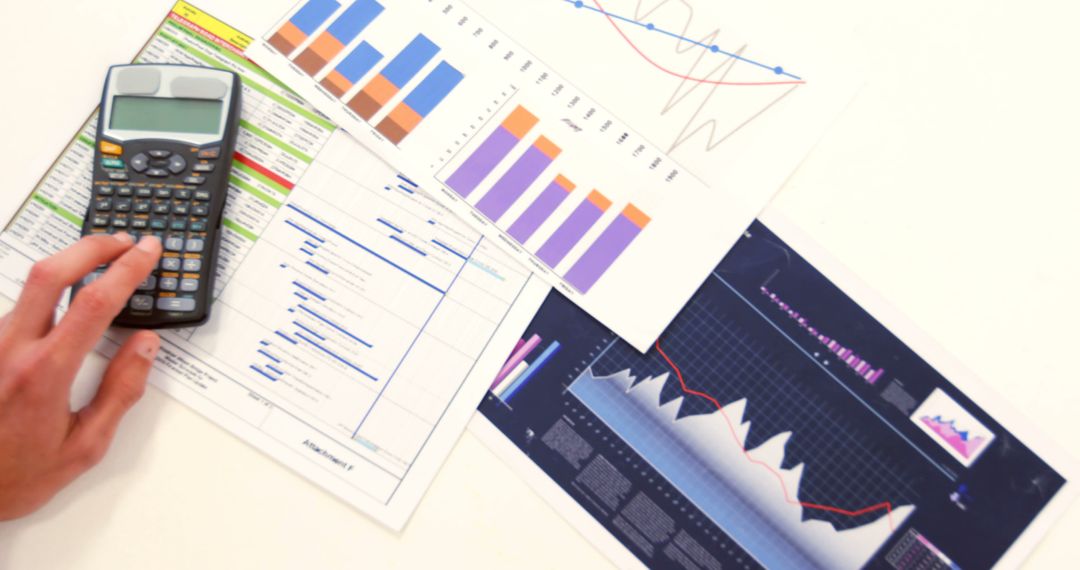
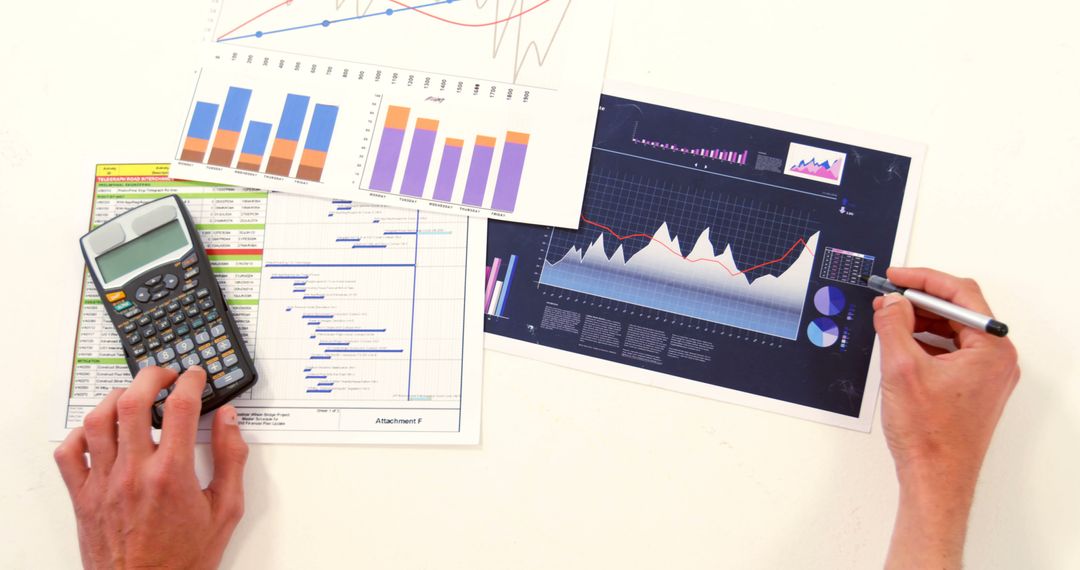
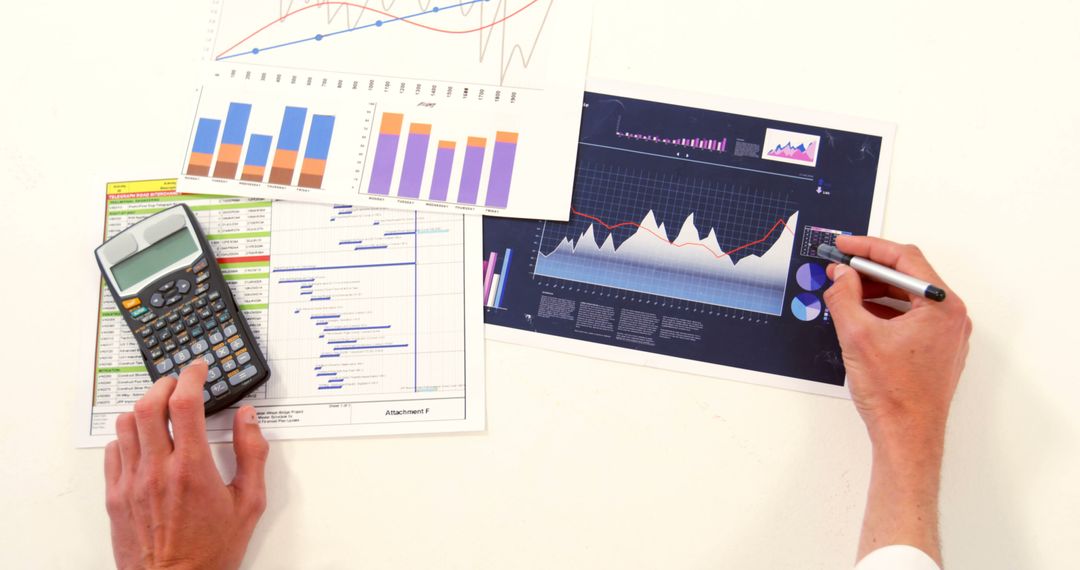
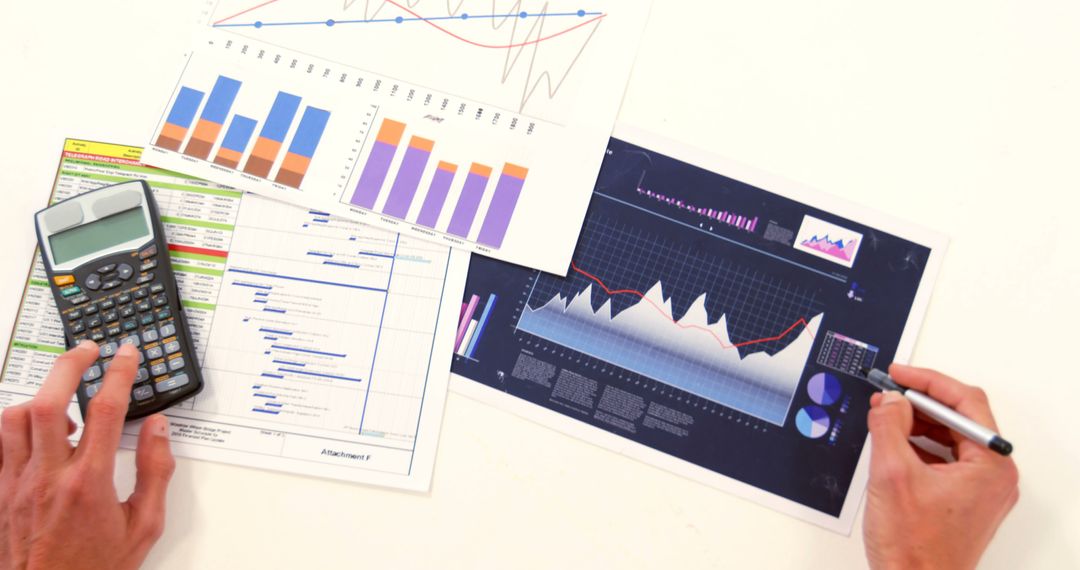
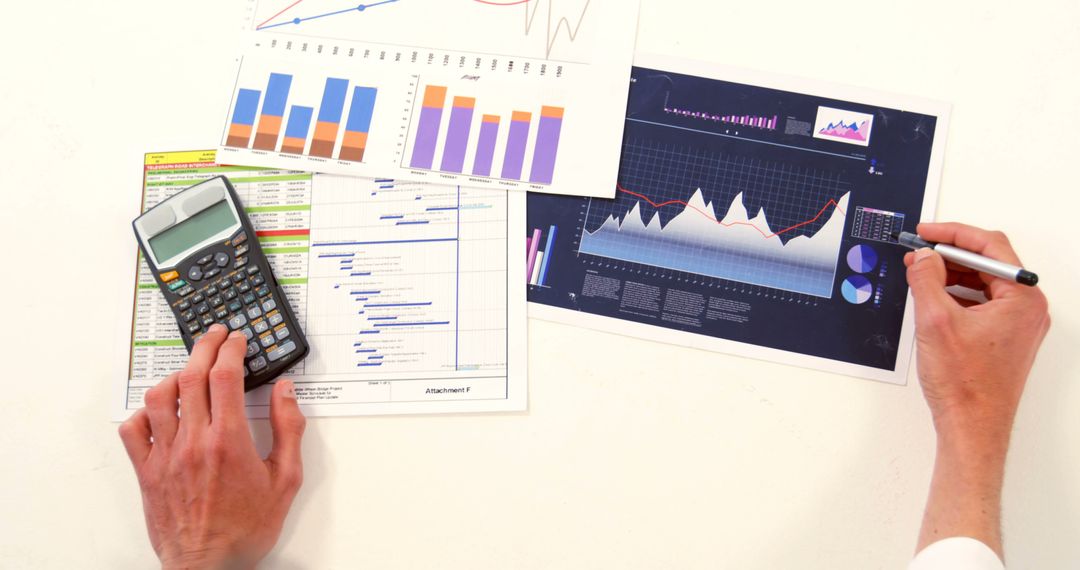
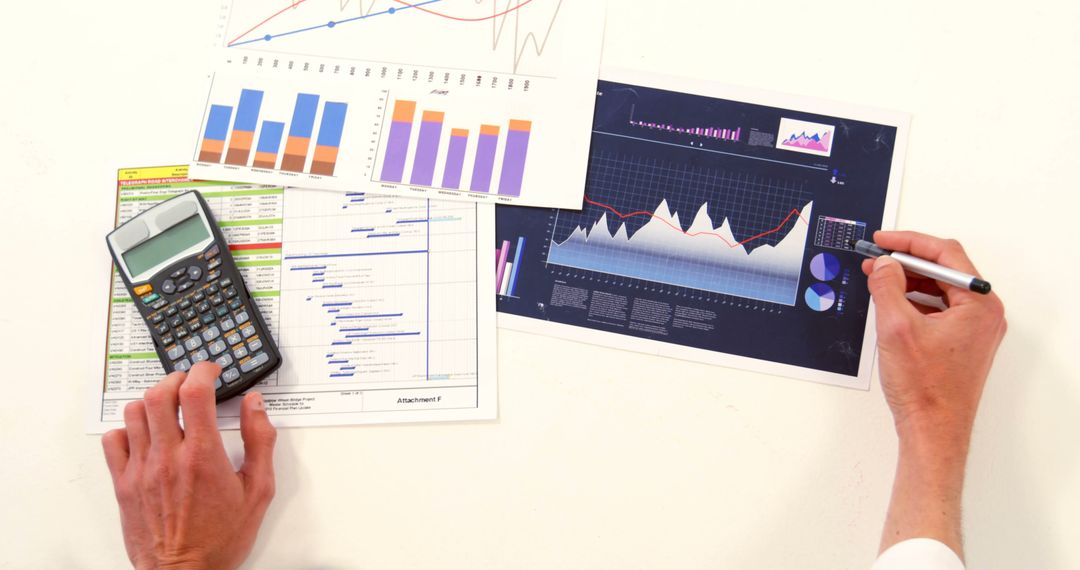
- Financial Planner's Workspace with Document and Graphs
Financial Planner's Workspace with Document and Graphs Image

Workspace featuring financial tools like spreadsheets and graphs on desk. Useful in content related to financial analysis, economic reports, or business planning scenarios focusing on statistical evaluation and financial documentation processes.
Powered by  - Get 15% off with code: PIKWIZARD15


6
downloads
downloads
Tags:
More
Credit Photo
If you would like to credit the Photo, here are some ways you can do so
Text Link
photo Link
<span class="text-link">
<span>
<a target="_blank" href=https://pikwizard.com/photo/financial-planners-workspace-with-document-and-graphs/44de4566830f96bfa631caa66cd5ddfb/>PikWizard</a>
</span>
</span>
<span class="image-link">
<span
style="margin: 0 0 20px 0; display: inline-block; vertical-align: middle; width: 100%;"
>
<a
target="_blank"
href="https://pikwizard.com/photo/financial-planners-workspace-with-document-and-graphs/44de4566830f96bfa631caa66cd5ddfb/"
style="text-decoration: none; font-size: 10px; margin: 0;"
>
<img src="https://pikwizard.com/pw/medium/44de4566830f96bfa631caa66cd5ddfb.jpg" style="margin: 0; width: 100%;" alt="" />
<p style="font-size: 12px; margin: 0;">PikWizard</p>
</a>
</span>
</span>
Free (free of charge)
Free for personal and commercial use.
Author: People Creations
Similar Free Stock Images

Premium


Premium


Premium


Premium


Premium


Premium


Premium


Premium


Premium


Premium


Premium


Premium


Premium


Premium


Premium


Premium


Premium


Premium


Premium


Premium


Premium


Premium


Premium


Premium