
- Home >
- Stock Photos >
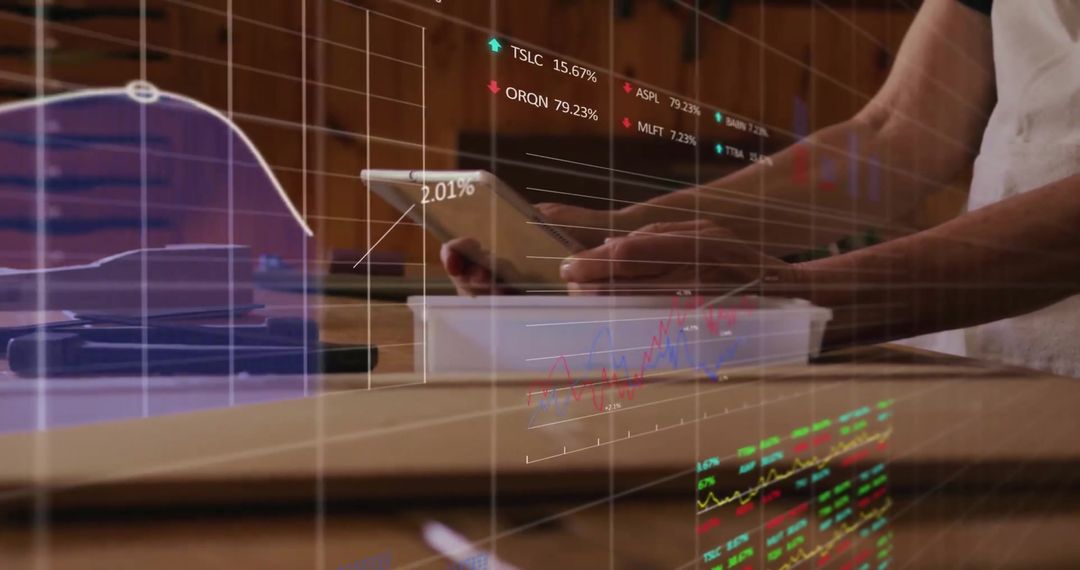
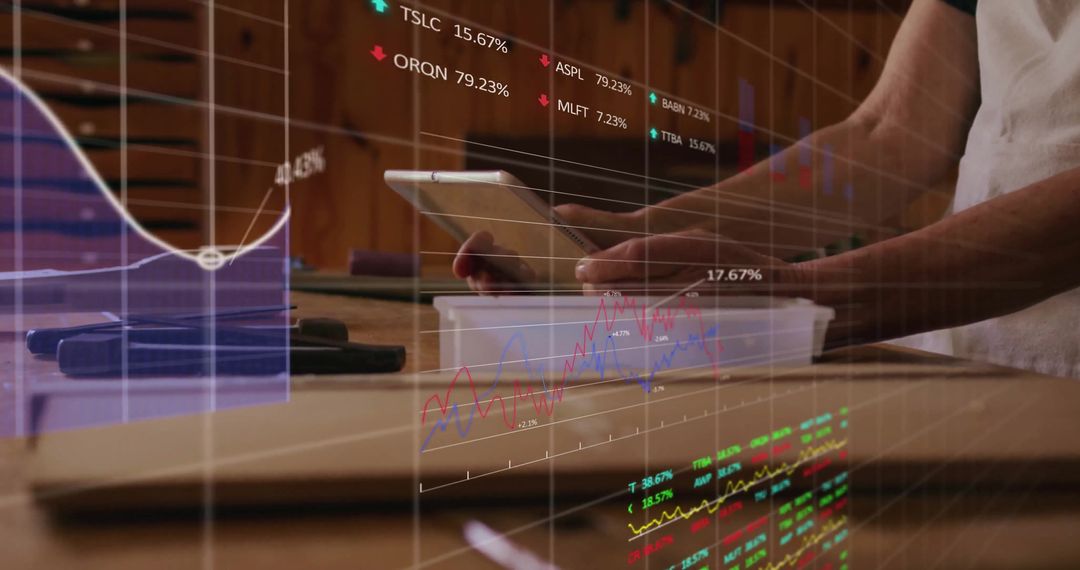
- Financial Stock Market Data Overlay on Wooden Desk
Financial Stock Market Data Overlay on Wooden Desk Image

Shows office desk setup with overlay of financial graphs and trends, ideal for conveying concepts like market analysis, finance and trading posts, or business strategy oriented communications.
Powered by 


2
downloads
downloads
Tags:
More
Credit Photo
If you would like to credit the Photo, here are some ways you can do so
Text Link
photo Link
<span class="text-link">
<span>
<a target="_blank" href=https://pikwizard.com/photo/financial-stock-market-data-overlay-on-wooden-desk/0f50ac9d046ac4690e779cfa7958d7ad/>PikWizard</a>
</span>
</span>
<span class="image-link">
<span
style="margin: 0 0 20px 0; display: inline-block; vertical-align: middle; width: 100%;"
>
<a
target="_blank"
href="https://pikwizard.com/photo/financial-stock-market-data-overlay-on-wooden-desk/0f50ac9d046ac4690e779cfa7958d7ad/"
style="text-decoration: none; font-size: 10px; margin: 0;"
>
<img src="https://pikwizard.com/pw/medium/0f50ac9d046ac4690e779cfa7958d7ad.jpg" style="margin: 0; width: 100%;" alt="" />
<p style="font-size: 12px; margin: 0;">PikWizard</p>
</a>
</span>
</span>
Free (free of charge)
Free for personal and commercial use.
Author: Awesome Content
Similar Free Stock Images

Premium


Premium


Premium


Premium


Premium


Premium


Premium


Premium


Premium


Premium


Premium


Premium


Premium


Premium


Premium


Premium


Premium


Premium


Premium


Premium


Premium


Premium


Premium


Premium

