
- Home >
- Stock Photos >
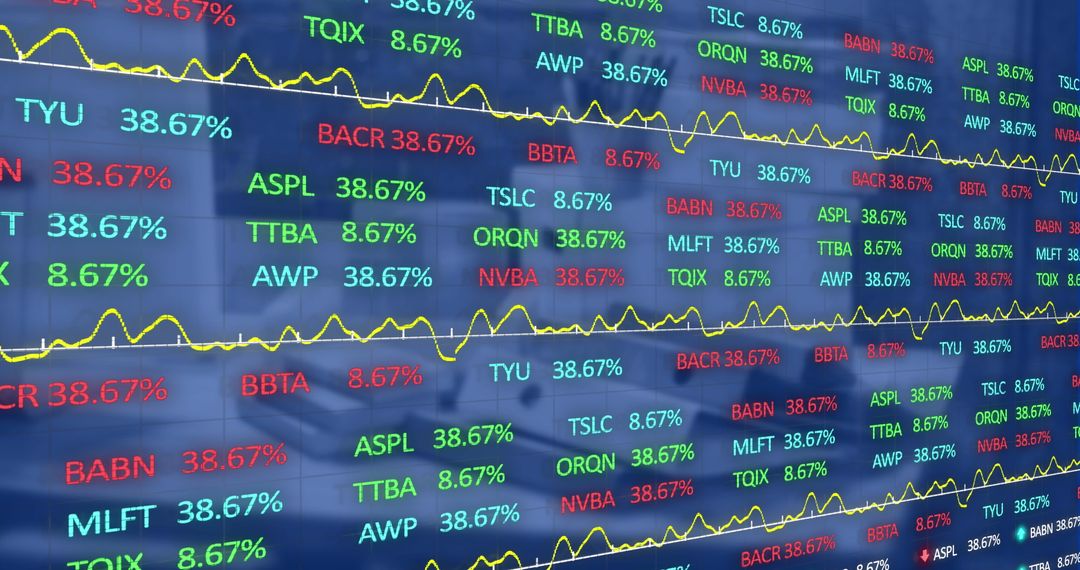
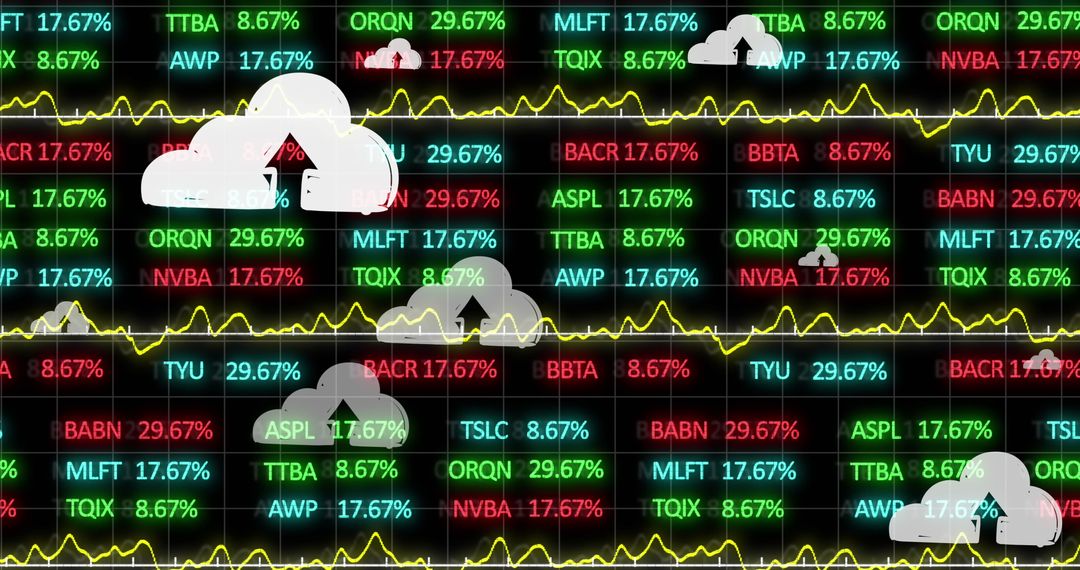
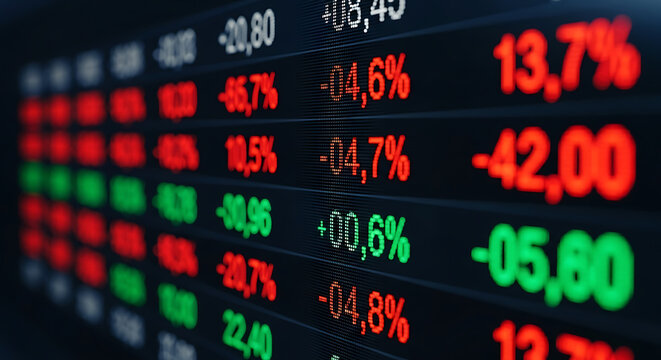
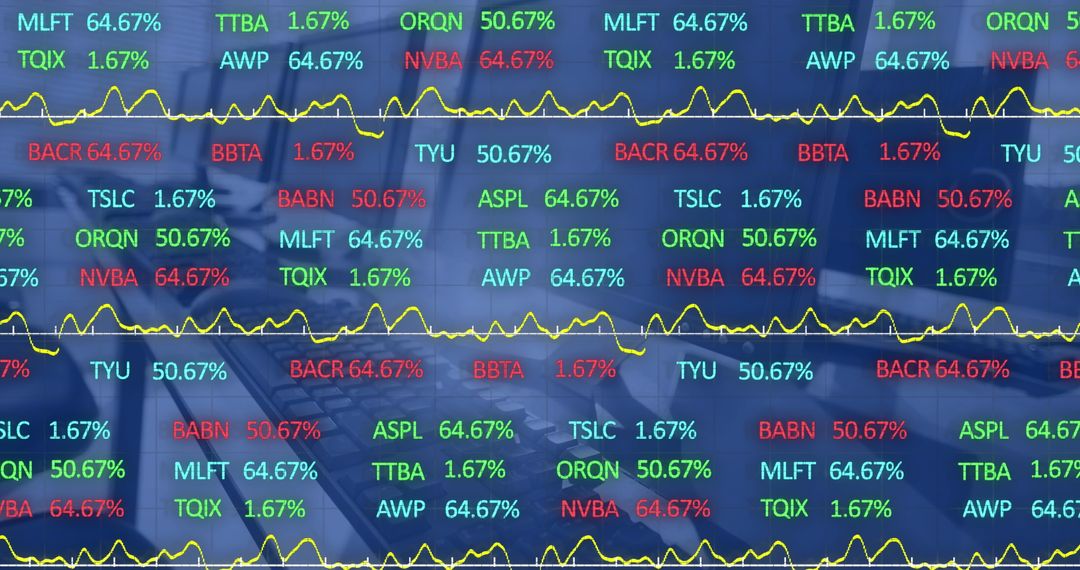
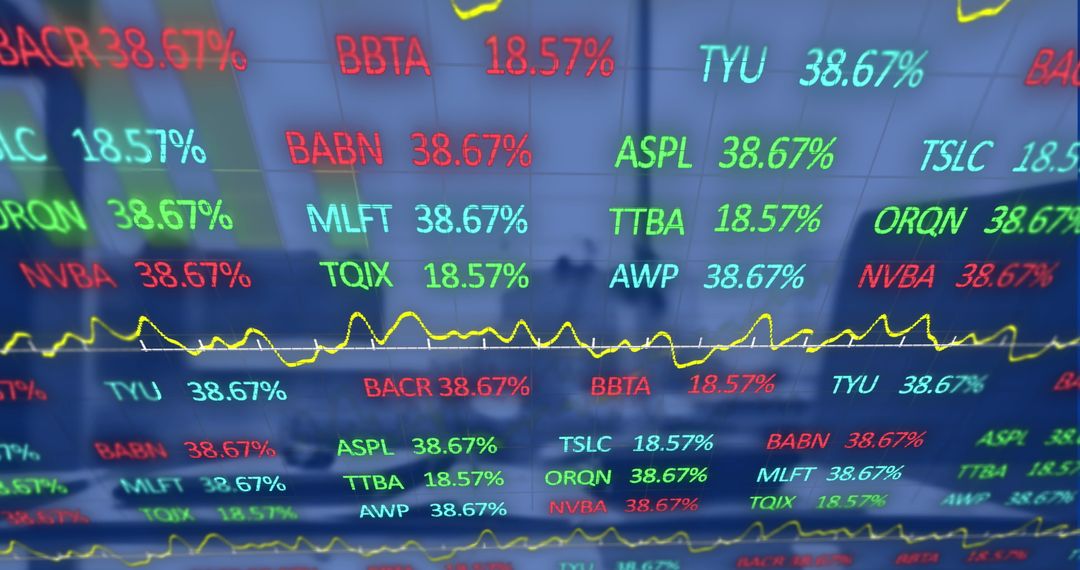
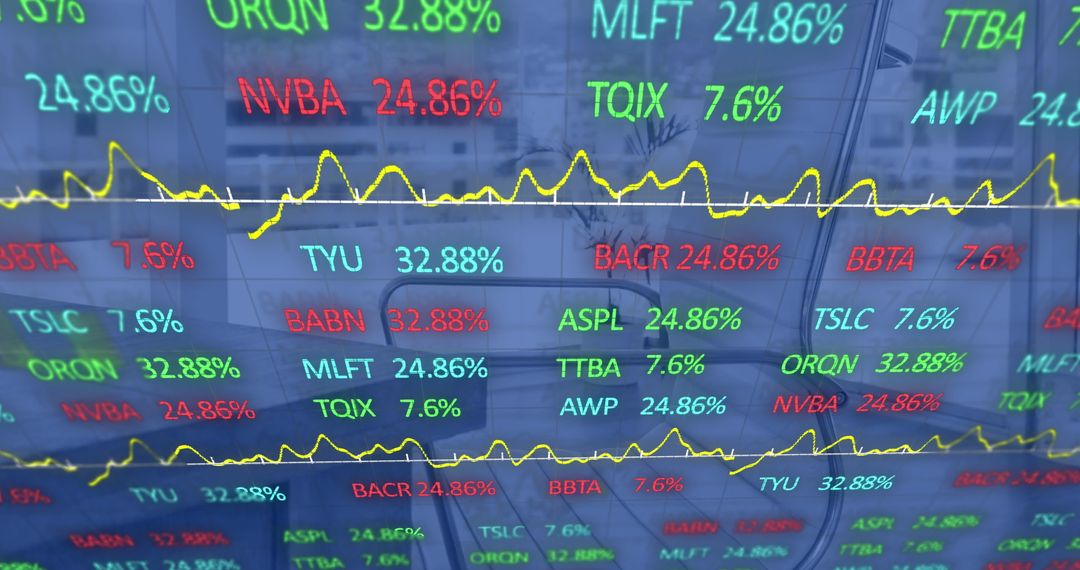
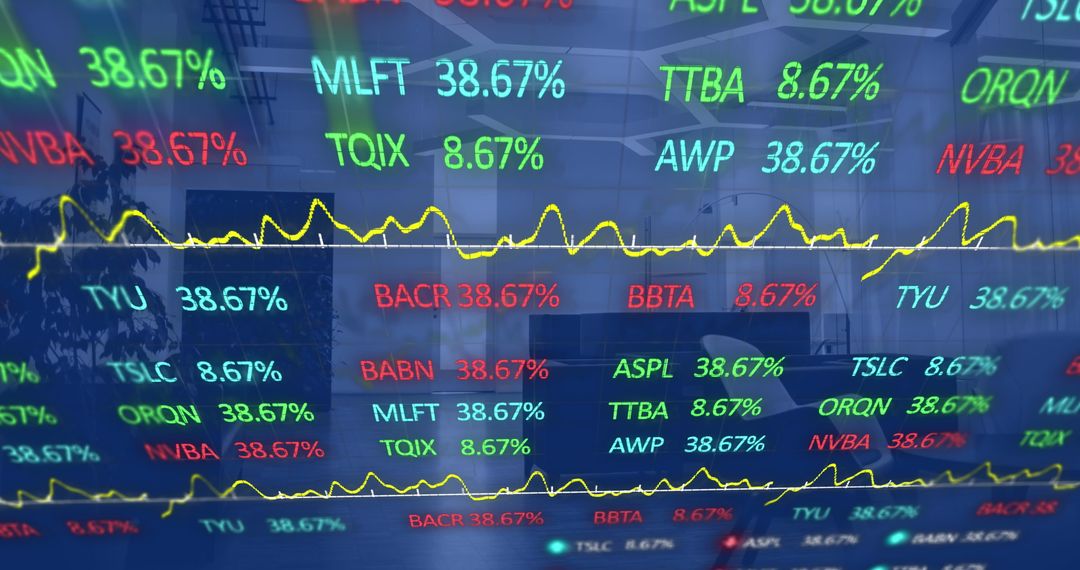
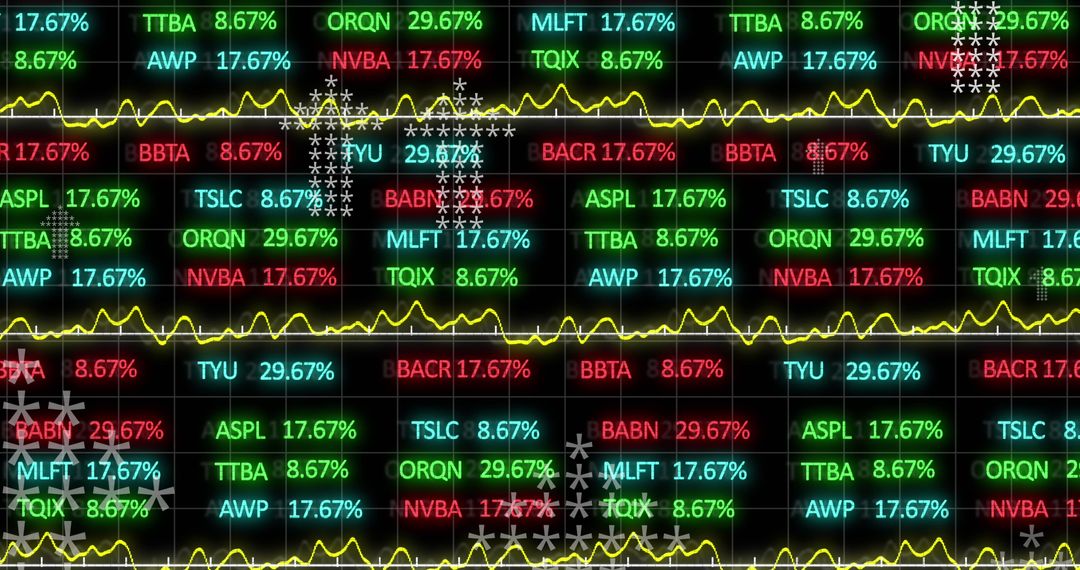
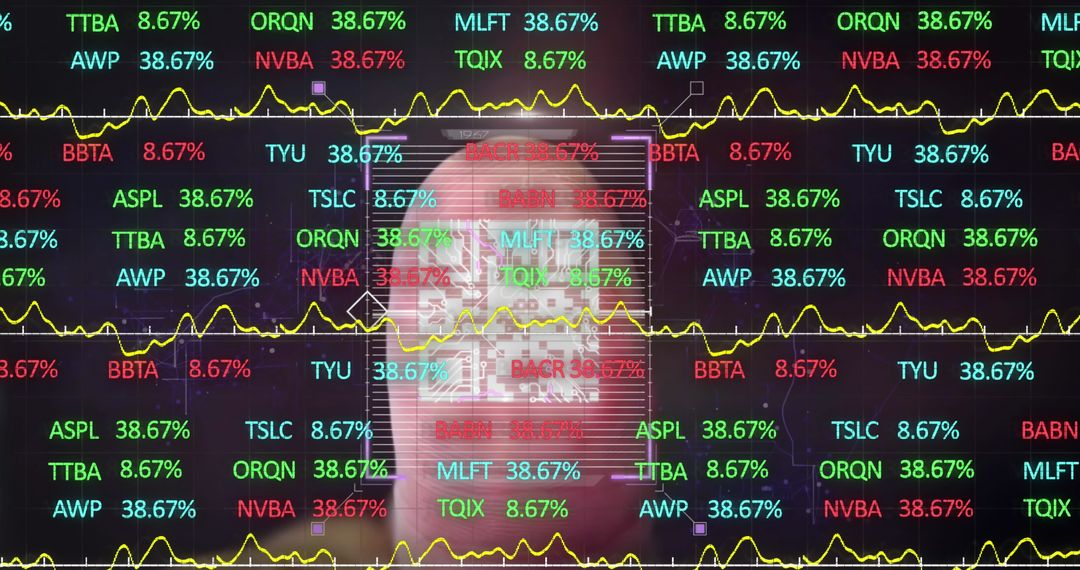
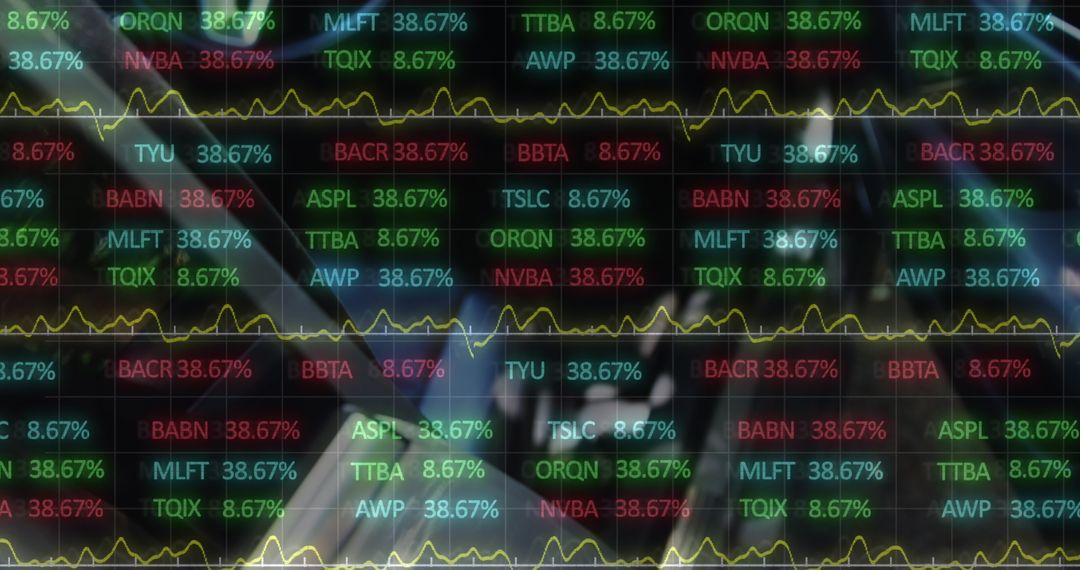
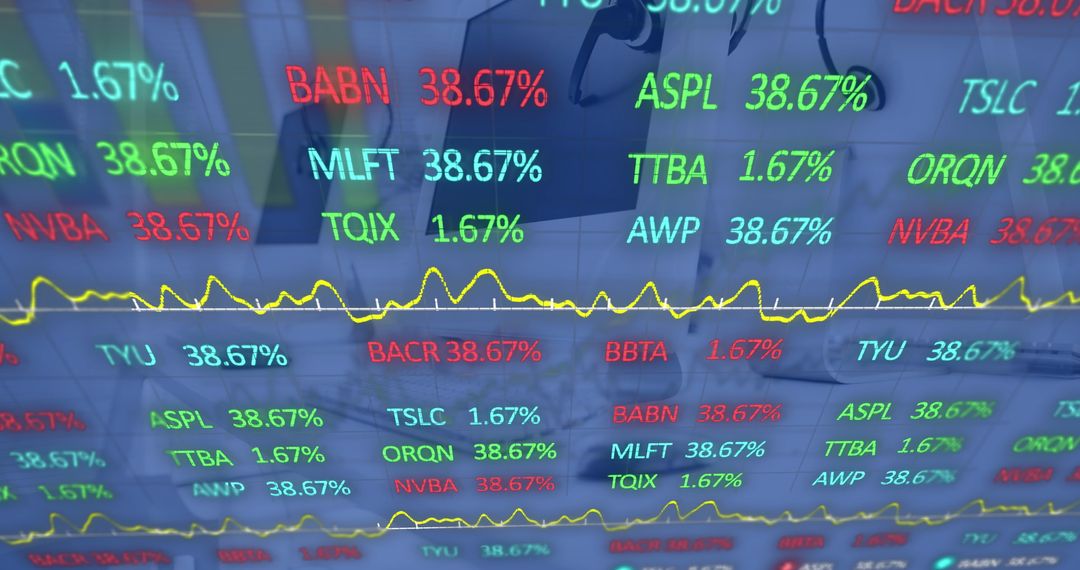
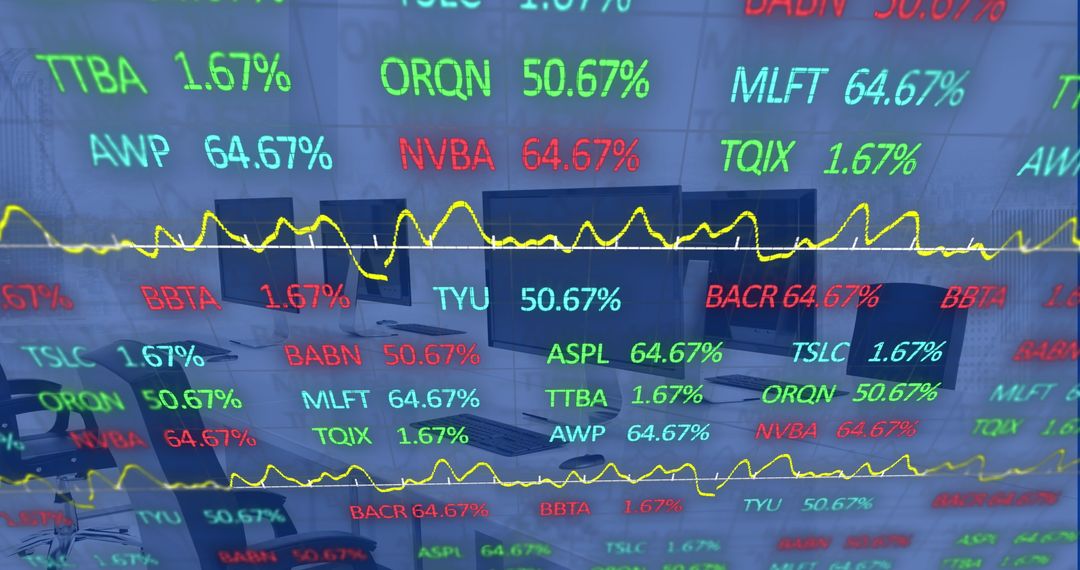
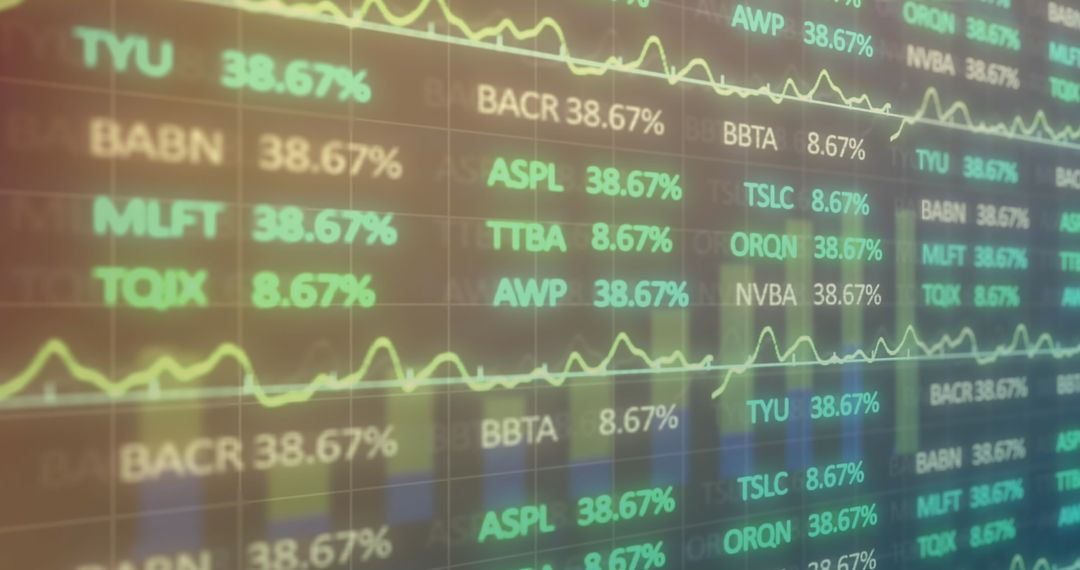
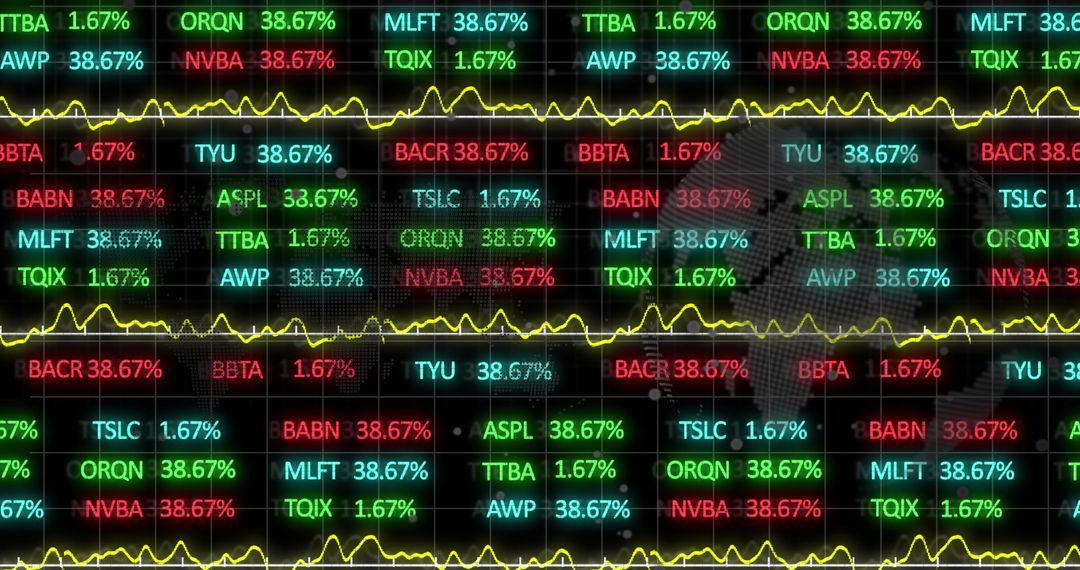
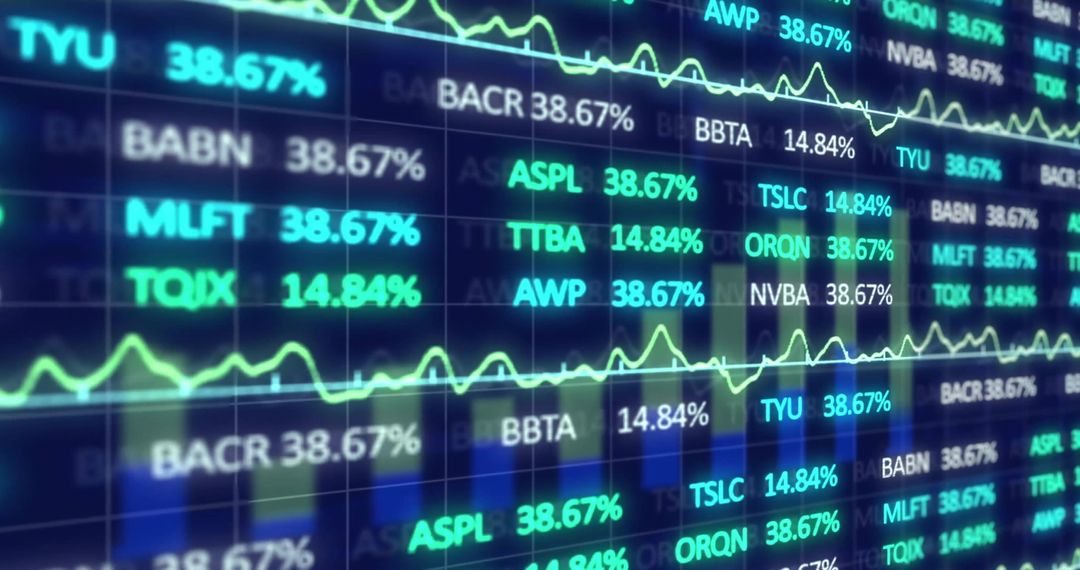
- Financial Trading Board With Graph Overlapped on Office Desks
Financial Trading Board With Graph Overlapped on Office Desks Image
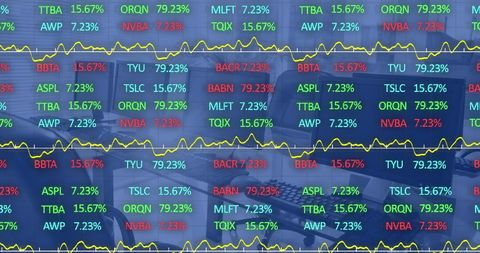
Numbers and stock symbols are displayed in bright colors over computer desks aligning like a digital overlay. Can be used to represent financial themes, technology-driven trends or comprehensive stock market analysis. Ideal for businesses or educational content exploring investment, technology in finance or showcasing dynamic financial environments.
Powered by 


2
downloads
downloads
Tags:
More
Credit Photo
If you would like to credit the Photo, here are some ways you can do so
Text Link
photo Link
<span class="text-link">
<span>
<a target="_blank" href=https://pikwizard.com/photo/financial-trading-board-with-graph-overlapped-on-office-desks/8c326b84fd7f364b3a7d9eb71da1d411/>PikWizard</a>
</span>
</span>
<span class="image-link">
<span
style="margin: 0 0 20px 0; display: inline-block; vertical-align: middle; width: 100%;"
>
<a
target="_blank"
href="https://pikwizard.com/photo/financial-trading-board-with-graph-overlapped-on-office-desks/8c326b84fd7f364b3a7d9eb71da1d411/"
style="text-decoration: none; font-size: 10px; margin: 0;"
>
<img src="https://pikwizard.com/pw/medium/8c326b84fd7f364b3a7d9eb71da1d411.jpg" style="margin: 0; width: 100%;" alt="" />
<p style="font-size: 12px; margin: 0;">PikWizard</p>
</a>
</span>
</span>
Free (free of charge)
Free for personal and commercial use.
Author: People Creations
Similar Free Stock Images

Premium


Premium


Premium


Premium


Premium


Premium


Premium


Premium


Premium


Premium


Premium


Premium


Premium


Premium

Premium


Premium


Premium


Premium


Premium


Premium


Premium


Premium


Premium


Premium

