- Home >
- Stock Photos >
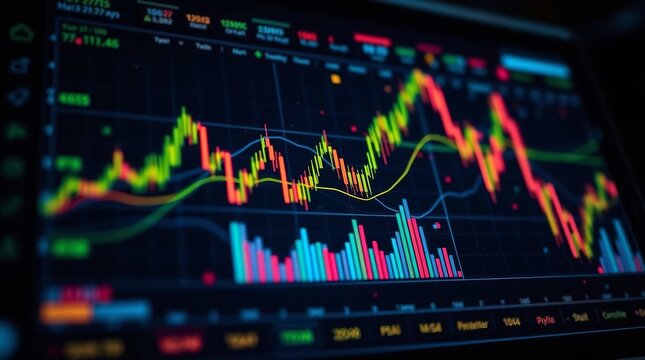
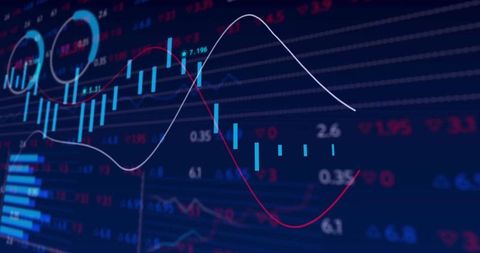
- Financial Trading Chart with Candlestick Bars and Trend Lines
Financial Trading Chart with Candlestick Bars and Trend Lines Image

This image shows a detailed financial trading chart featuring blue candlestick bars and prominently displayed white and red trend lines on a digital screen. Perfect for illustrating concepts in finance and stock market analysis, it can be used in investment guides, financial consultancy presentations, or technology-focused marketing materials to effectively convey complex analytics rapidly and clearly.
Powered by 


0
downloads
downloads
Tags:
More
Credit Photo
If you would like to credit the Photo, here are some ways you can do so
Text Link
photo Link
<span class="text-link">
<span>
<a target="_blank" href=https://pikwizard.com/photo/financial-trading-chart-with-candlestick-bars-and-trend-lines/57e0920b61614c1094a36438e314e853/>PikWizard</a>
</span>
</span>
<span class="image-link">
<span
style="margin: 0 0 20px 0; display: inline-block; vertical-align: middle; width: 100%;"
>
<a
target="_blank"
href="https://pikwizard.com/photo/financial-trading-chart-with-candlestick-bars-and-trend-lines/57e0920b61614c1094a36438e314e853/"
style="text-decoration: none; font-size: 10px; margin: 0;"
>
<img src="https://pikwizard.com/pw/medium/57e0920b61614c1094a36438e314e853.jpg" style="margin: 0; width: 100%;" alt="" />
<p style="font-size: 12px; margin: 0;">PikWizard</p>
</a>
</span>
</span>
Free (free of charge)
Free for personal and commercial use.
Author: Awesome Content
Similar Free Stock Images
Loading...

Premium


Premium


Premium


Premium


Premium


Premium


Premium


Premium

Premium


Premium


Premium


Premium


Premium


Premium


Premium
Premium


Premium


Premium


Premium


Premium

Premium


Premium


Premium


Premium

Premium