- Home >
- Stock Photos >
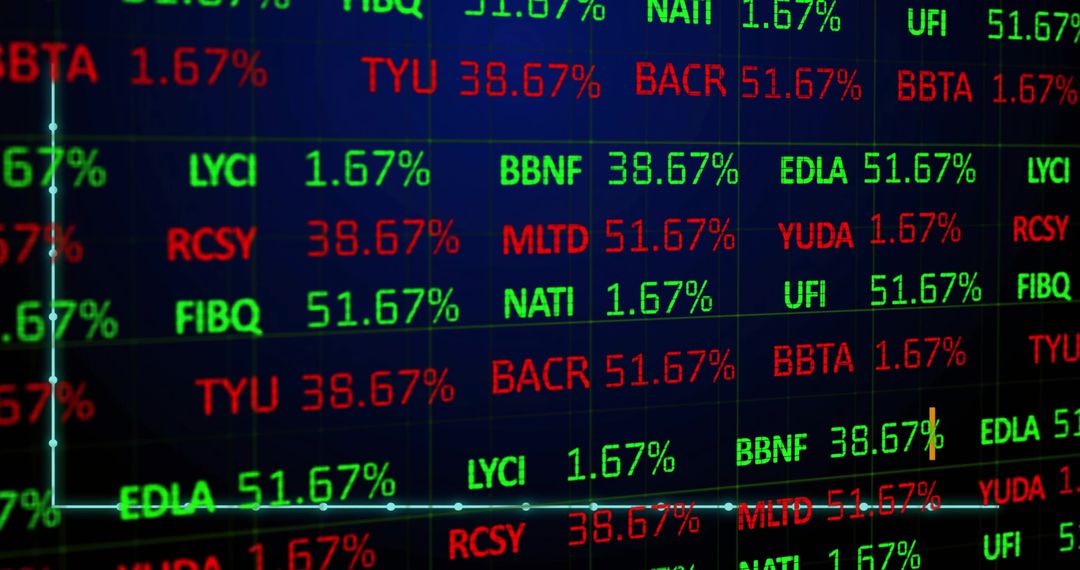
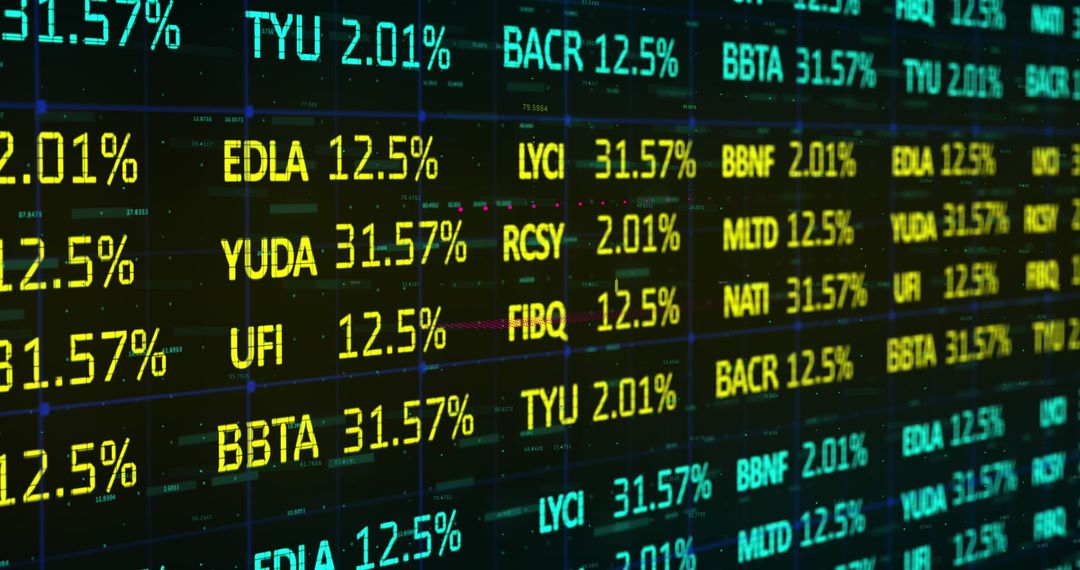
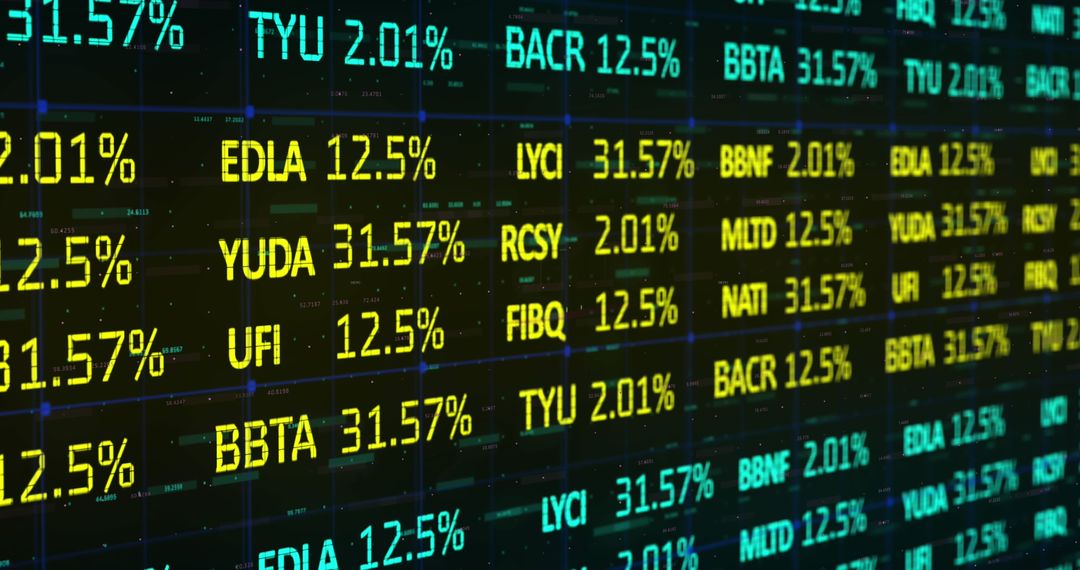
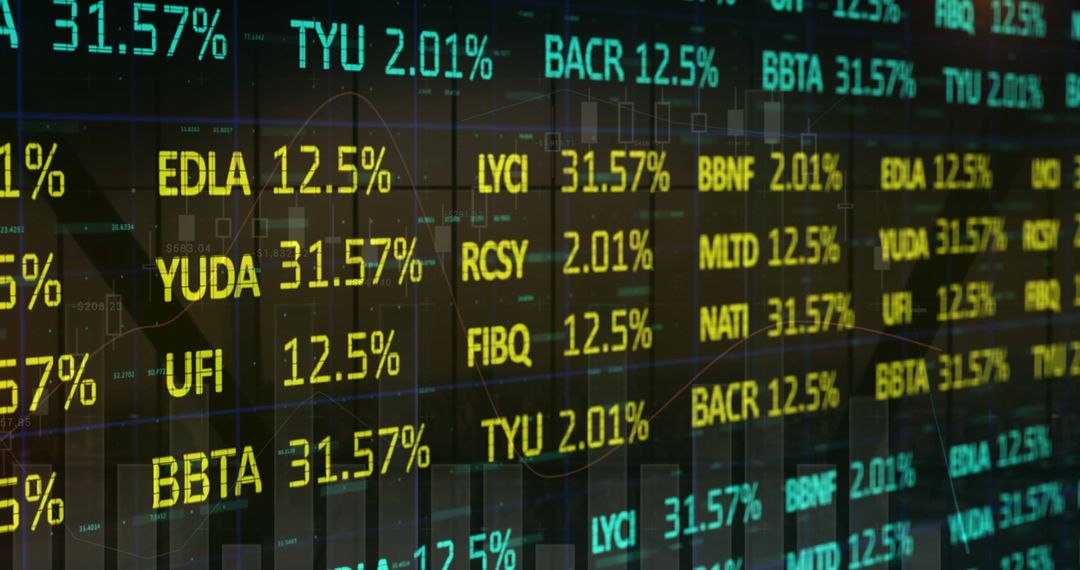
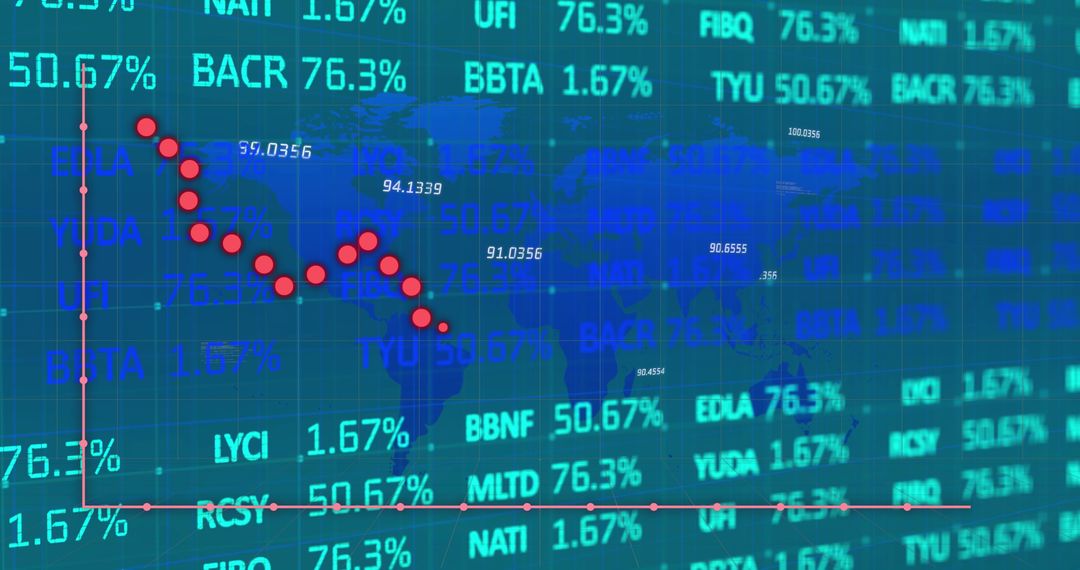
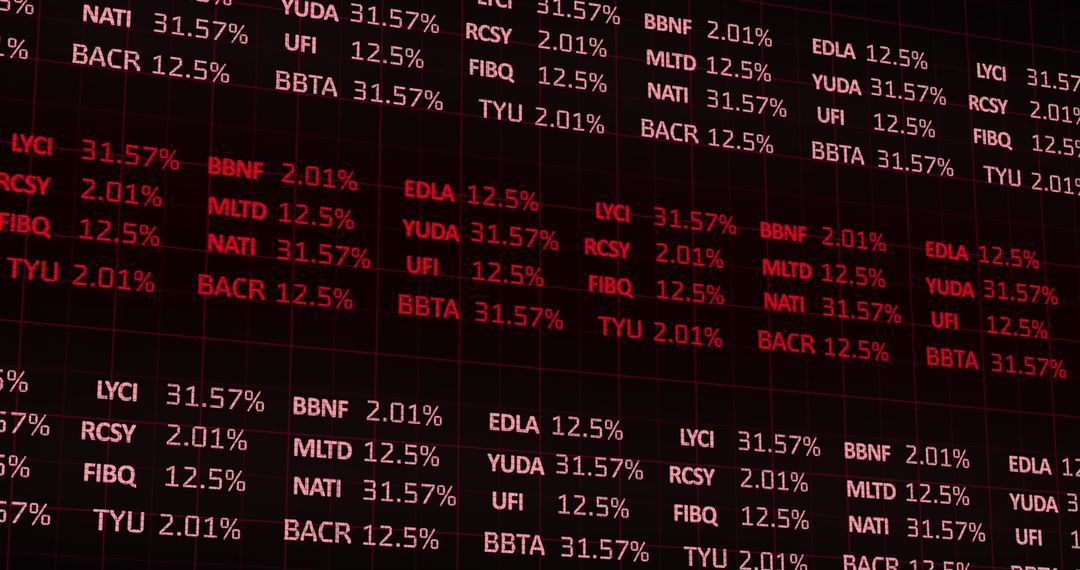
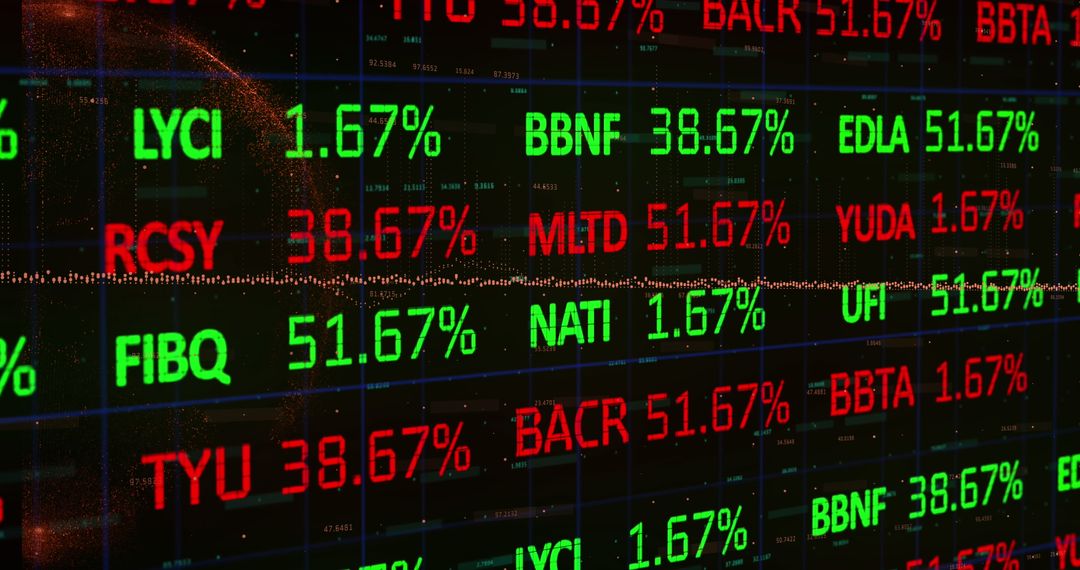
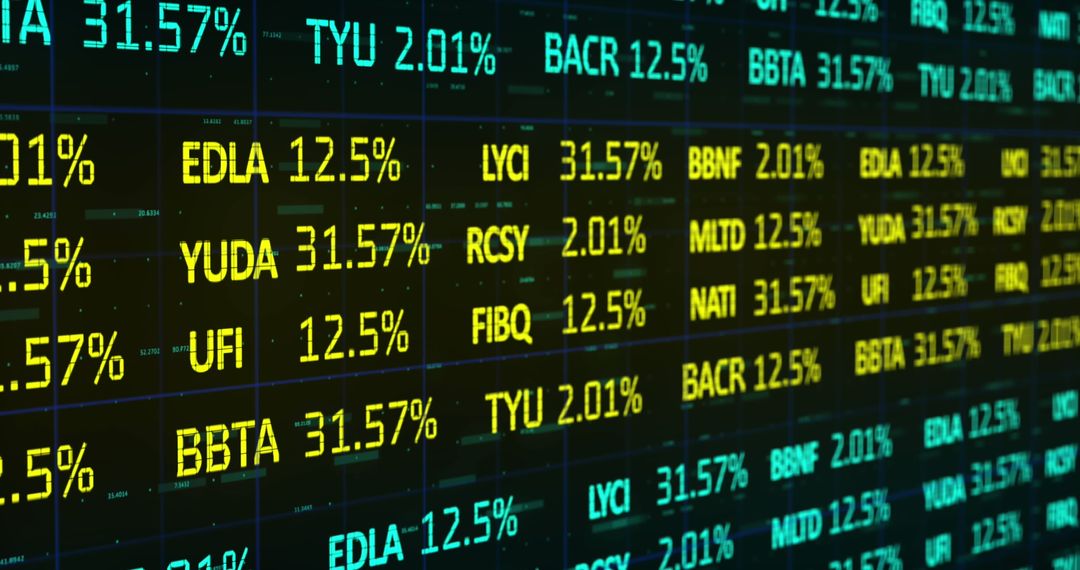
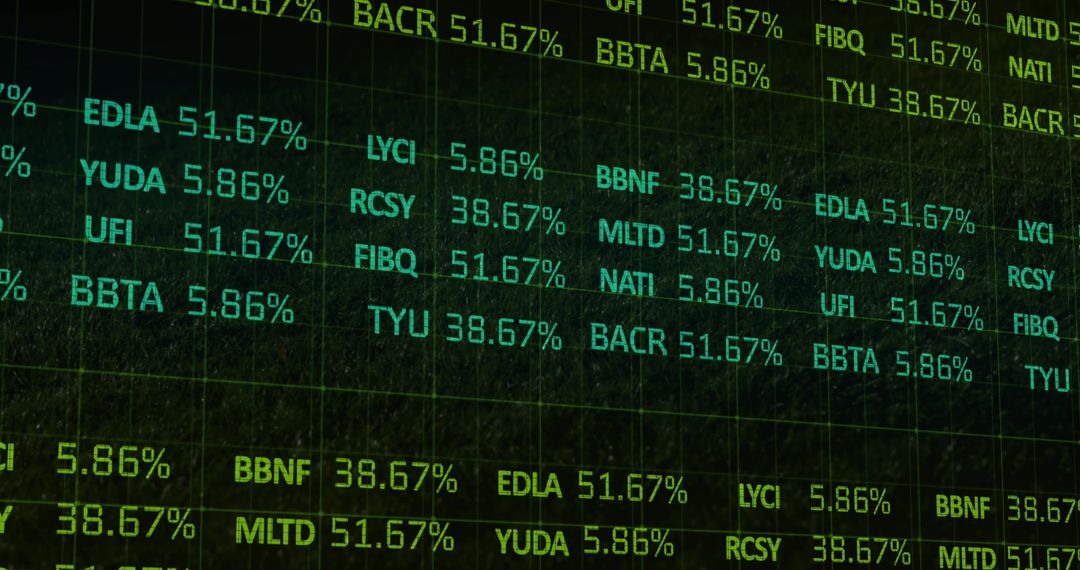
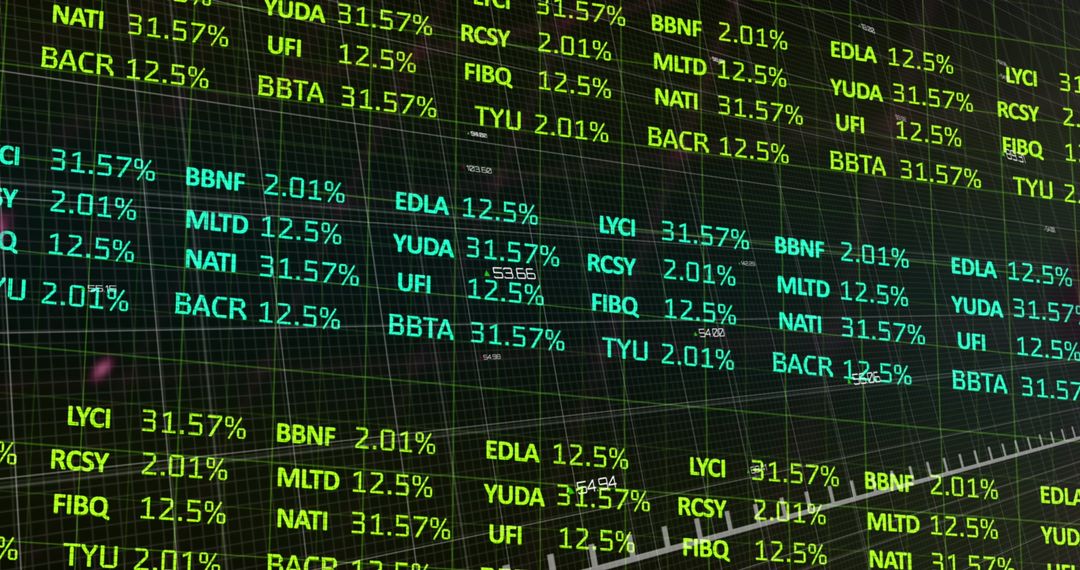
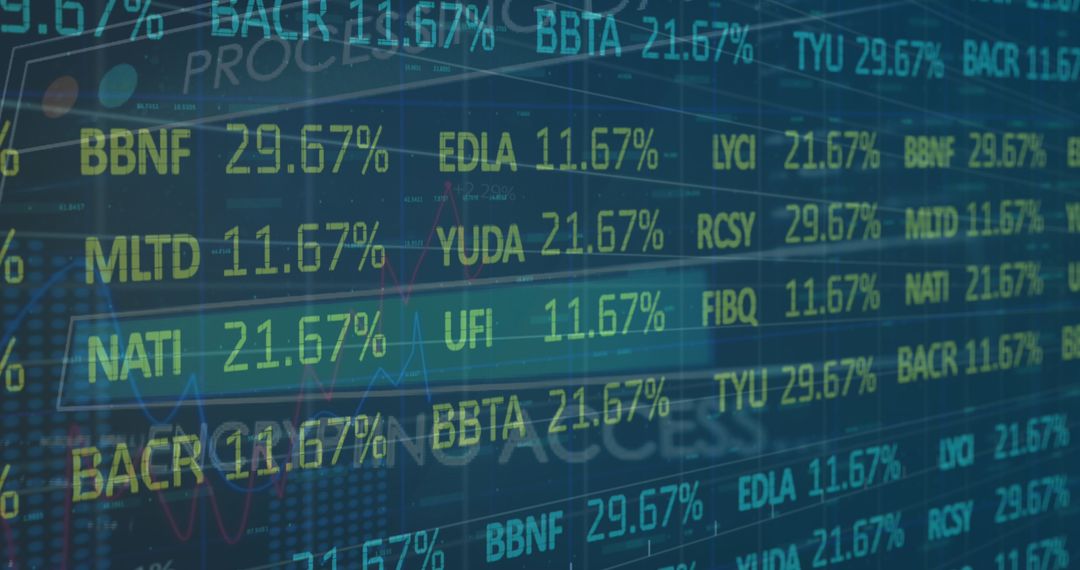
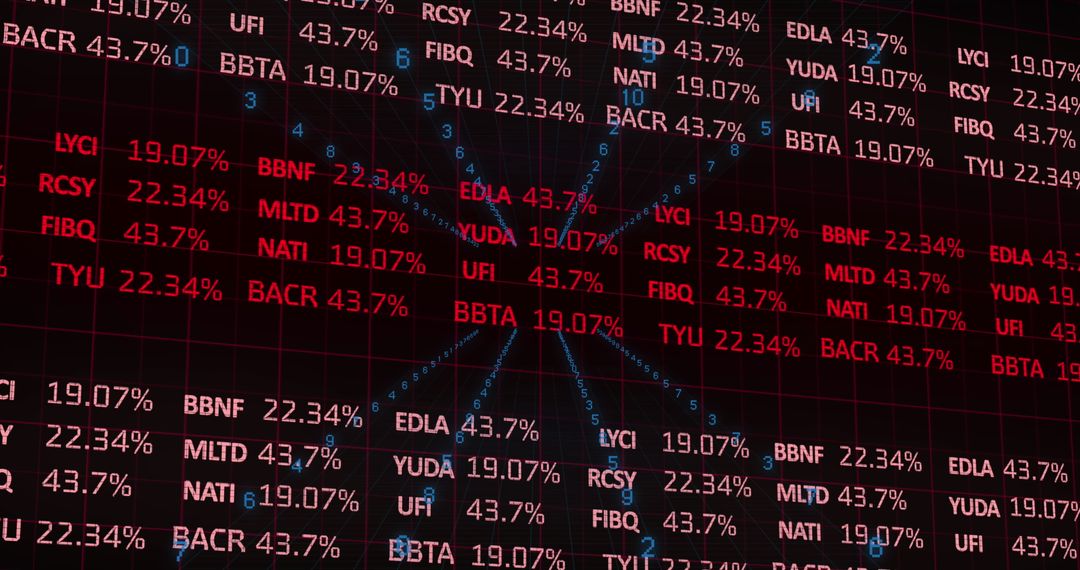
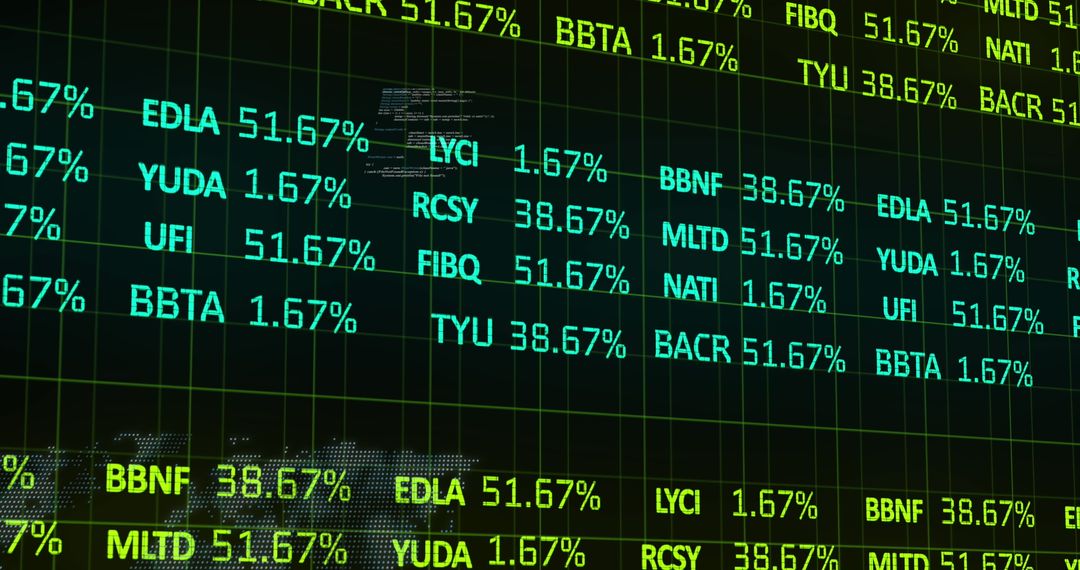
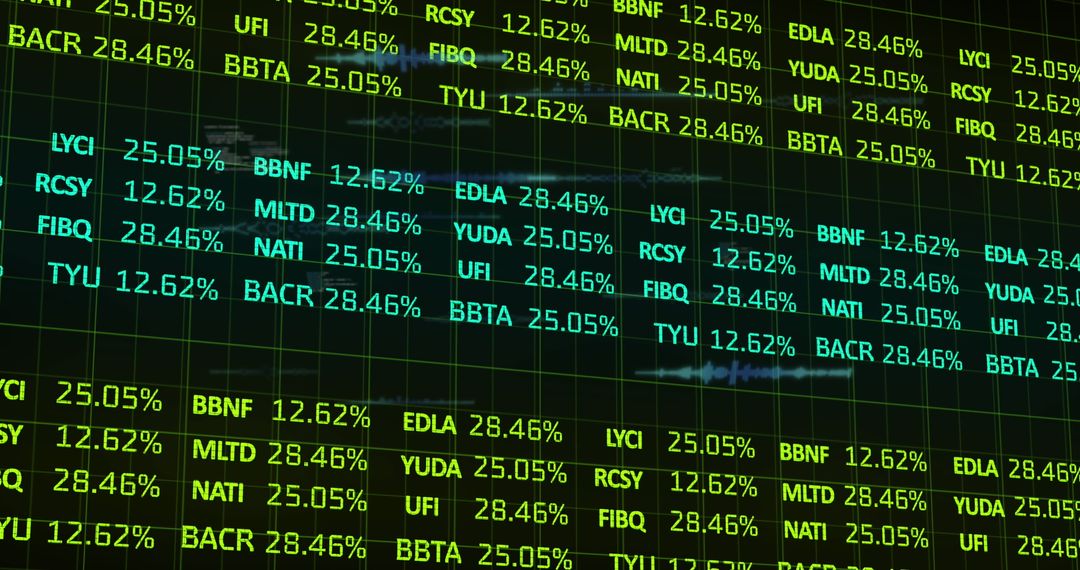
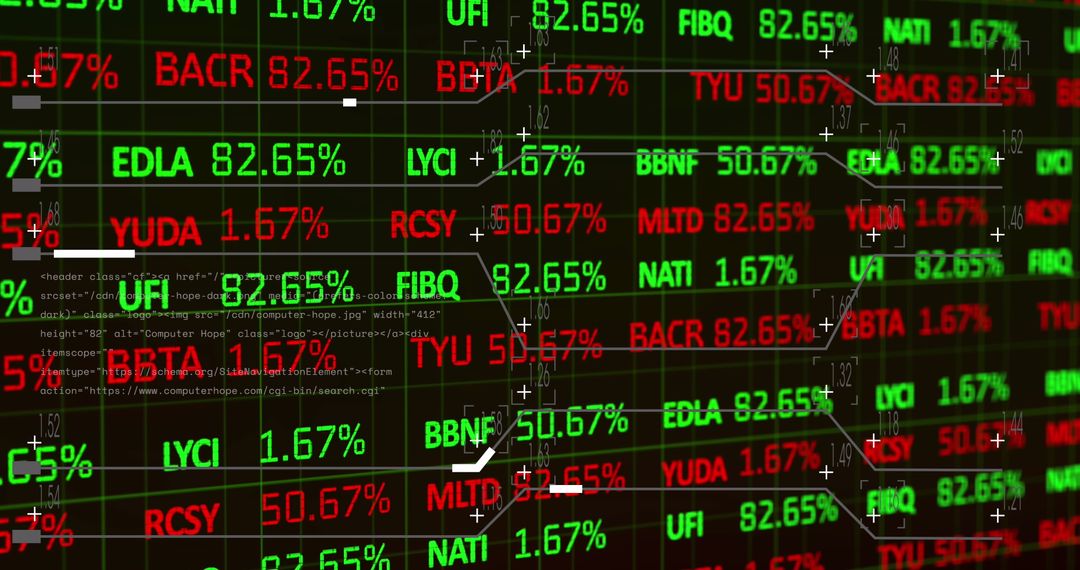
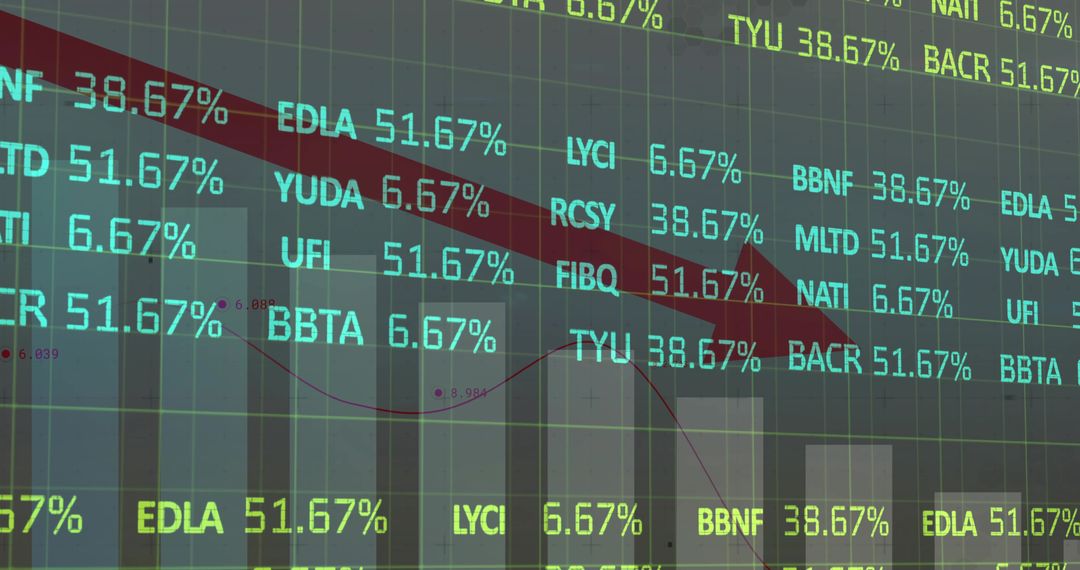
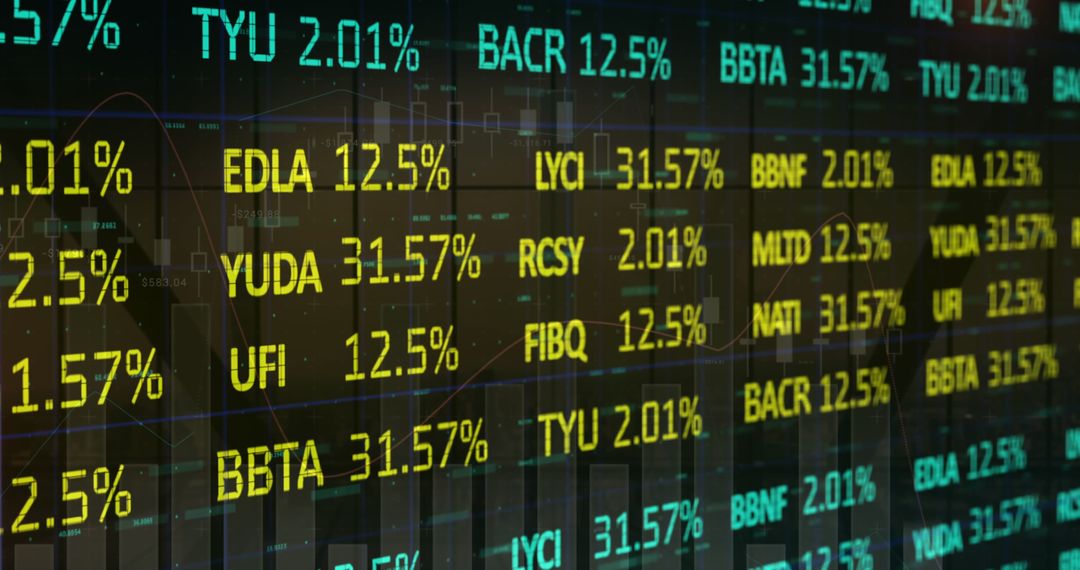
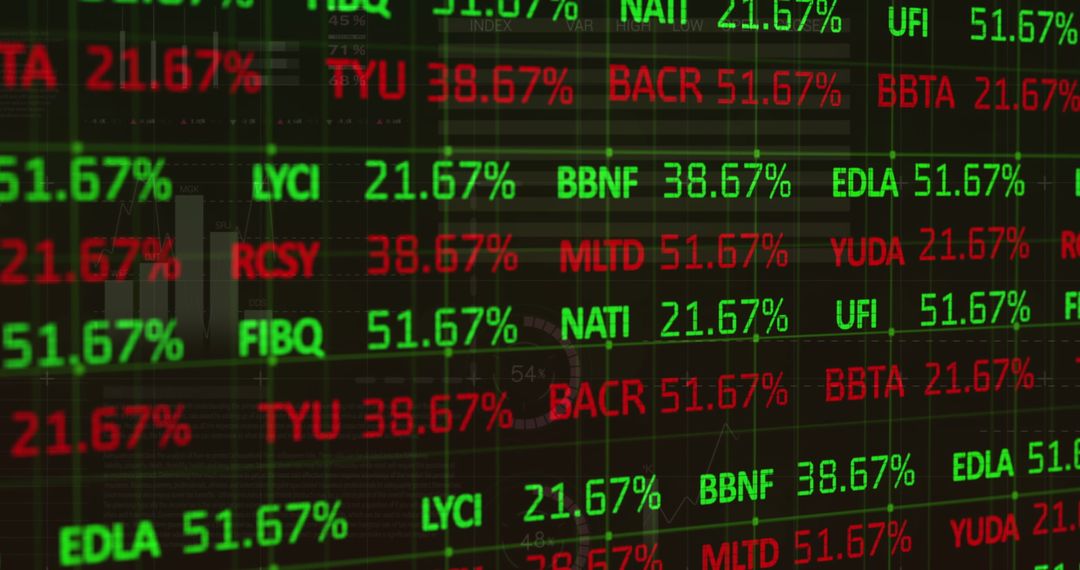
- Financial trading dashboard displaying stock tickers, percentage changes and grid analytics
Financial trading dashboard displaying stock tickers, percentage changes and grid analytics Image

High-resolution digital trading dashboard displaying stock tickers, percentage values, and layered grid for market analysis. Neon green and teal palette conveying technology and data-driven finance. Useful for illustrating financial technology, trading platforms, market research, and investment analysis. Ideal for website headers, investor presentations, pitch decks, blog posts about market trends, and app UI mockups. Supporting compositing for adding custom logos, charts, or text overlays. Supporting editorial use in finance news, corporate reports, and fintech marketing campaigns.
Powered by  - Get 15% off with code: PIKWIZARD15


0
downloads
downloads
Tags:
More
Credit Photo
If you would like to credit the Photo, here are some ways you can do so
Text Link
photo Link
<span class="text-link">
<span>
<a target="_blank" href=https://pikwizard.com/photo/financial-trading-dashboard-displaying-stock-tickers-percentage-changes-and-grid-analytics/31160df55bf0df20bd614e890593db83/>PikWizard</a>
</span>
</span>
<span class="image-link">
<span
style="margin: 0 0 20px 0; display: inline-block; vertical-align: middle; width: 100%;"
>
<a
target="_blank"
href="https://pikwizard.com/photo/financial-trading-dashboard-displaying-stock-tickers-percentage-changes-and-grid-analytics/31160df55bf0df20bd614e890593db83/"
style="text-decoration: none; font-size: 10px; margin: 0;"
>
<img src="https://pikwizard.com/pw/medium/31160df55bf0df20bd614e890593db83.jpg" style="margin: 0; width: 100%;" alt="" />
<p style="font-size: 12px; margin: 0;">PikWizard</p>
</a>
</span>
</span>
Free (free of charge)
Free for personal and commercial use.
Author: Creative Art
Similar Free Stock Images
Premium


Premium


Premium


Premium


Premium


Premium


Premium


Premium

Premium


Premium


Premium


Premium


Premium


Premium


Premium

Premium


Premium


Premium


Premium


Premium


Premium


Premium


Premium


Premium