- Home >
- Stock Photos >
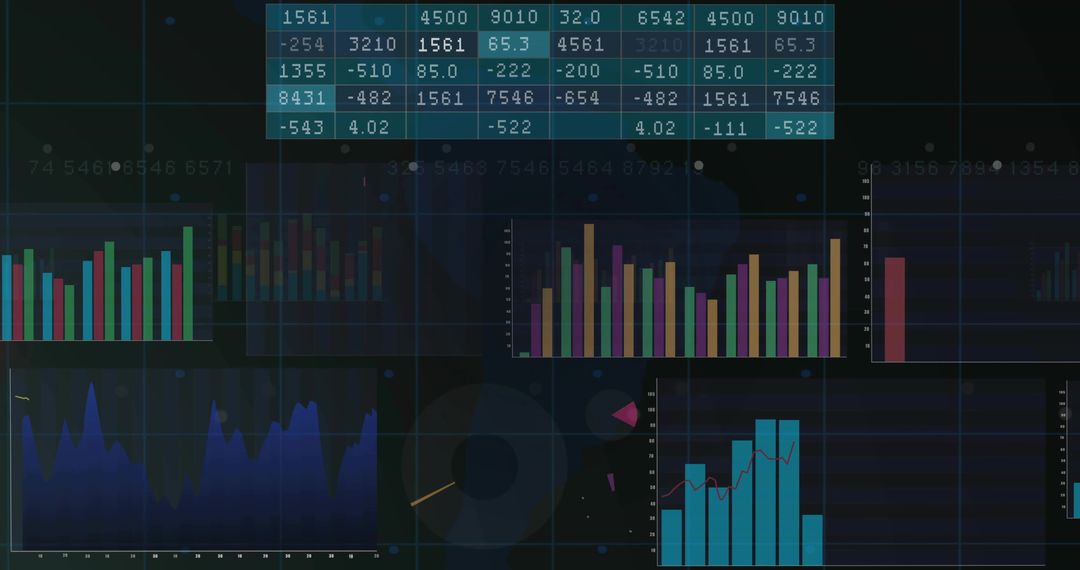
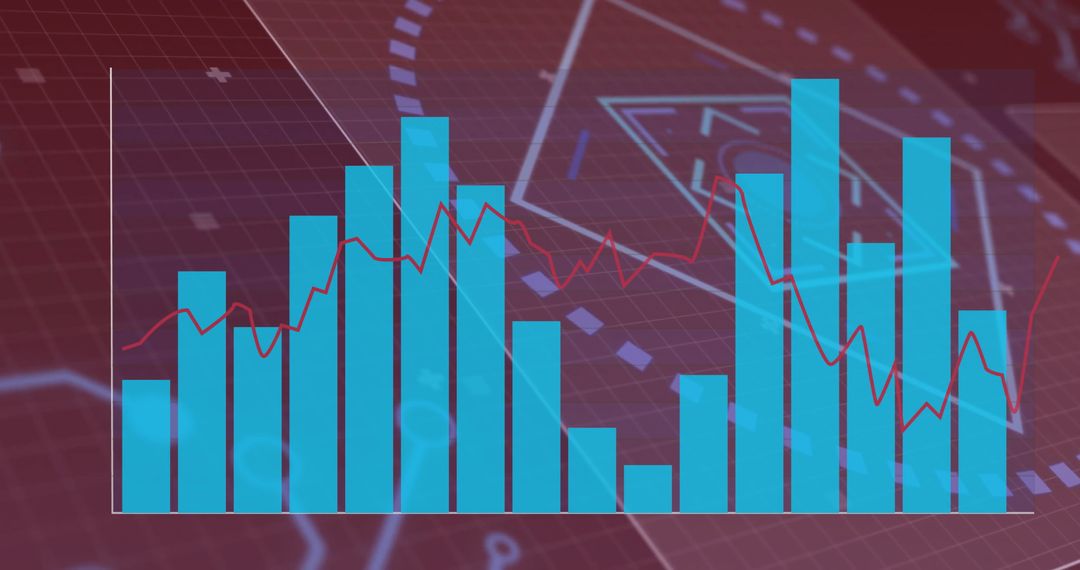
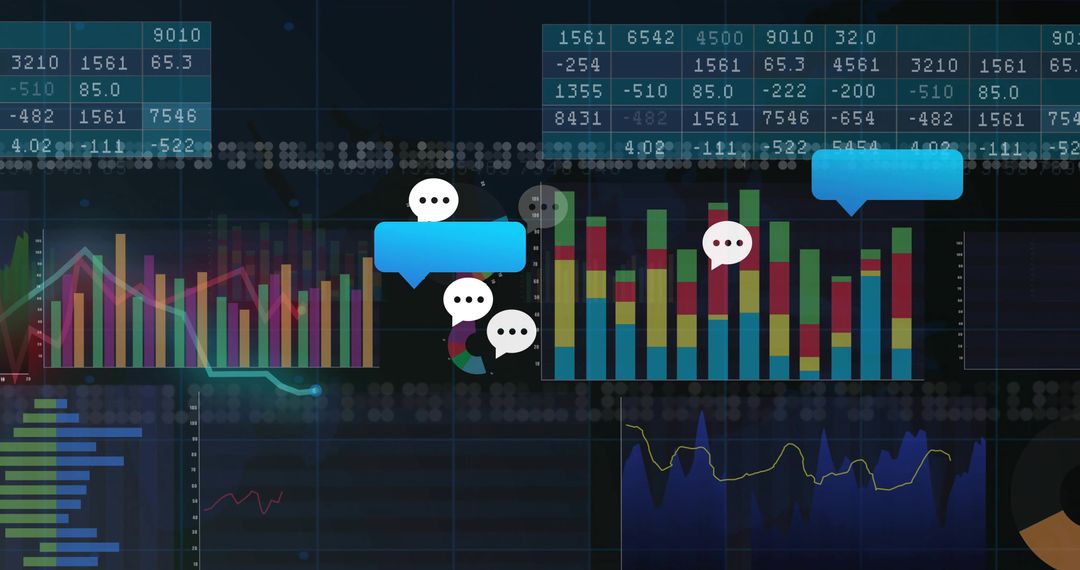
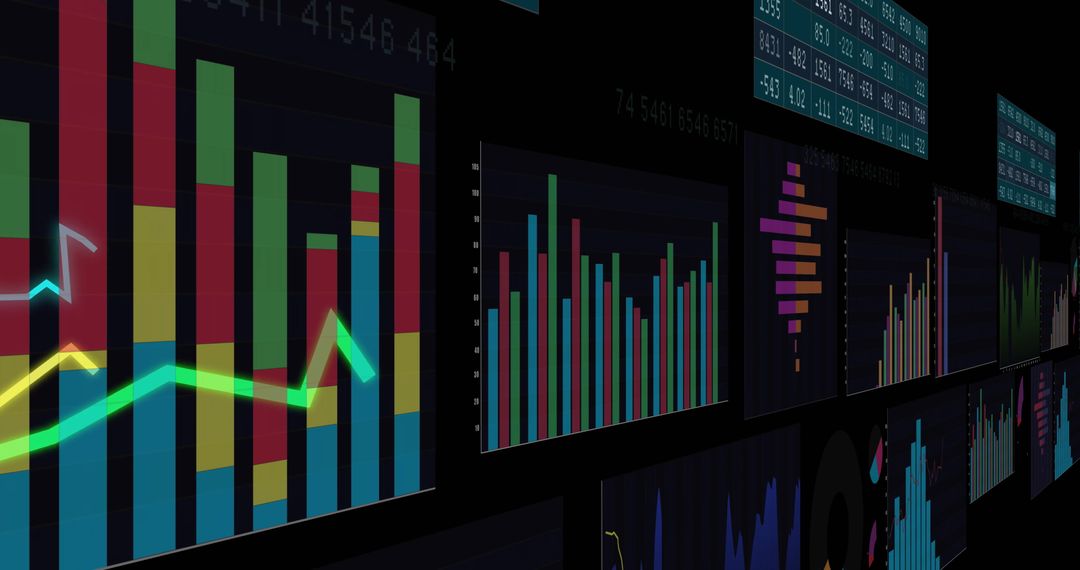
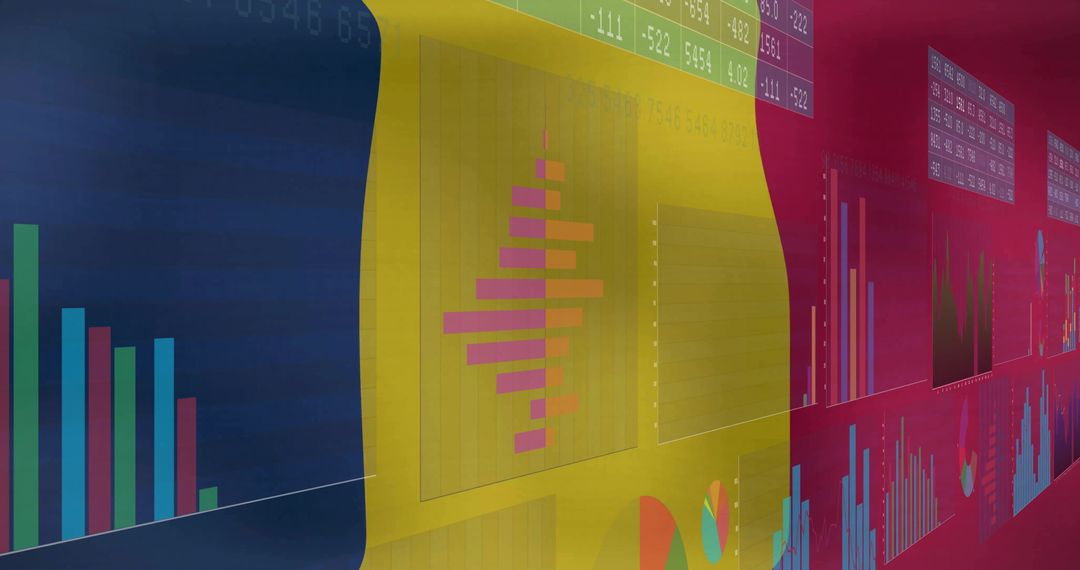
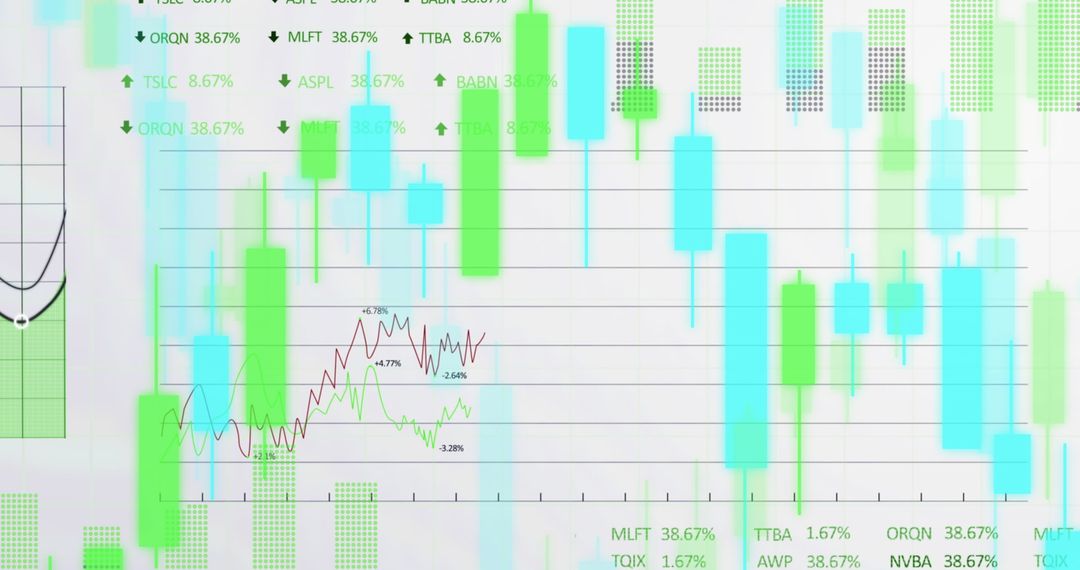
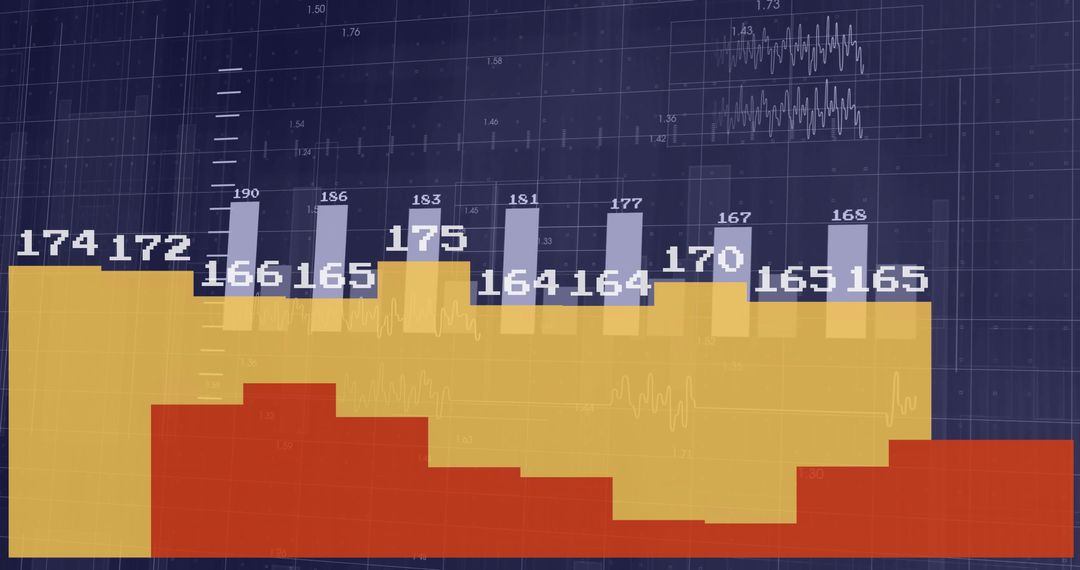
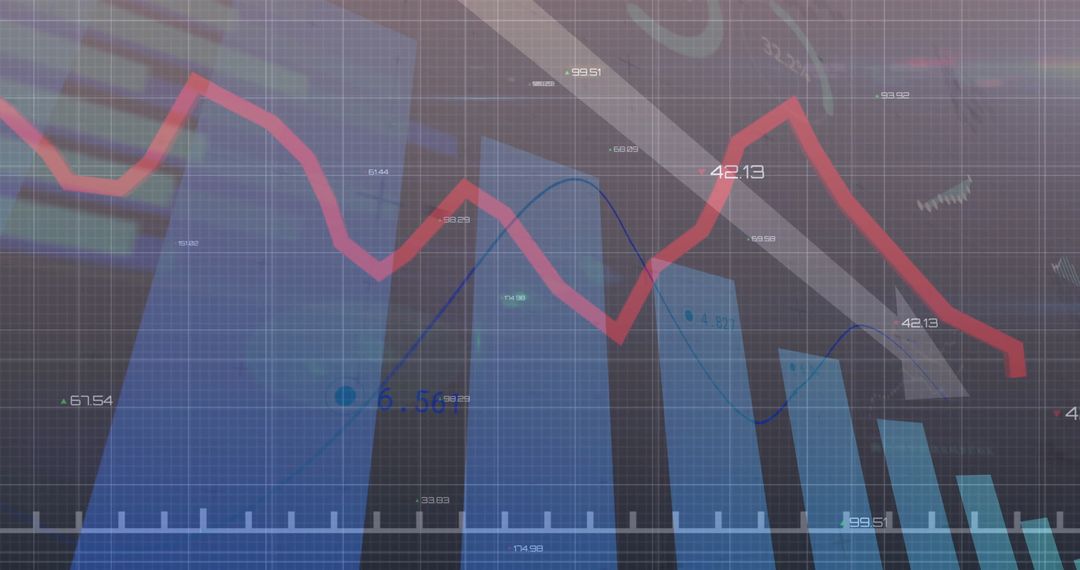
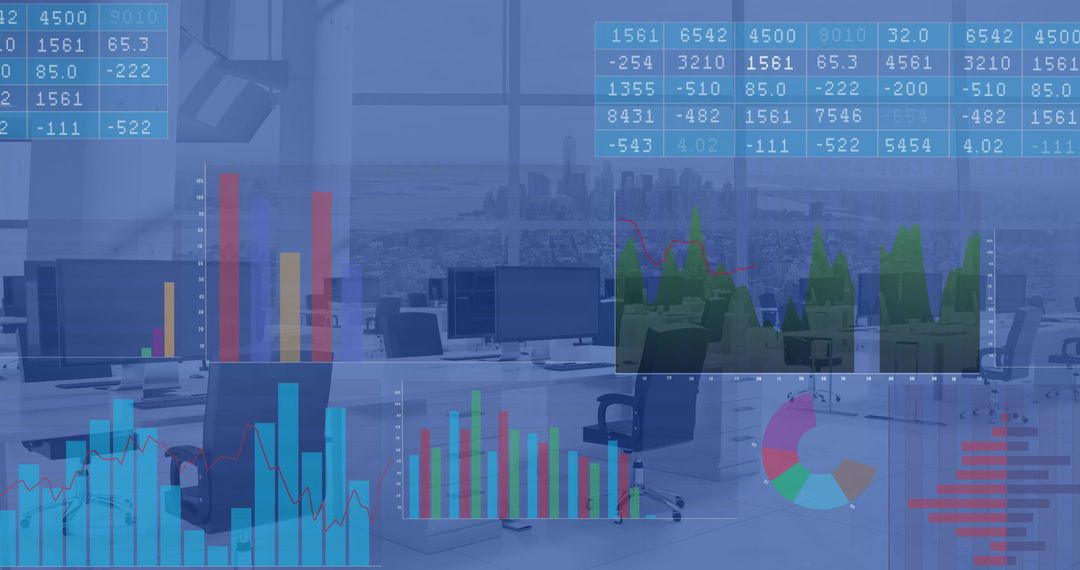
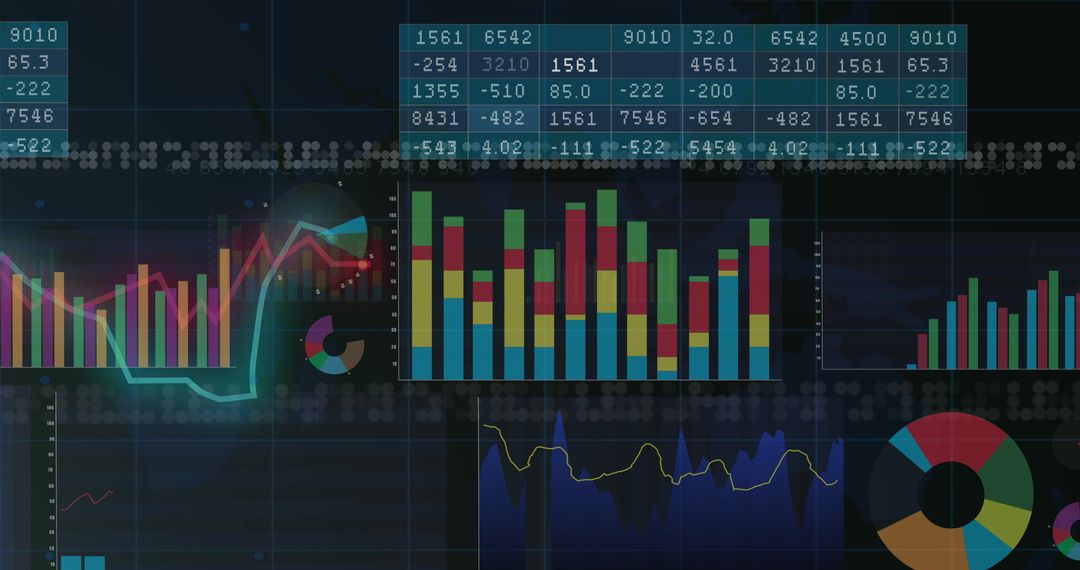
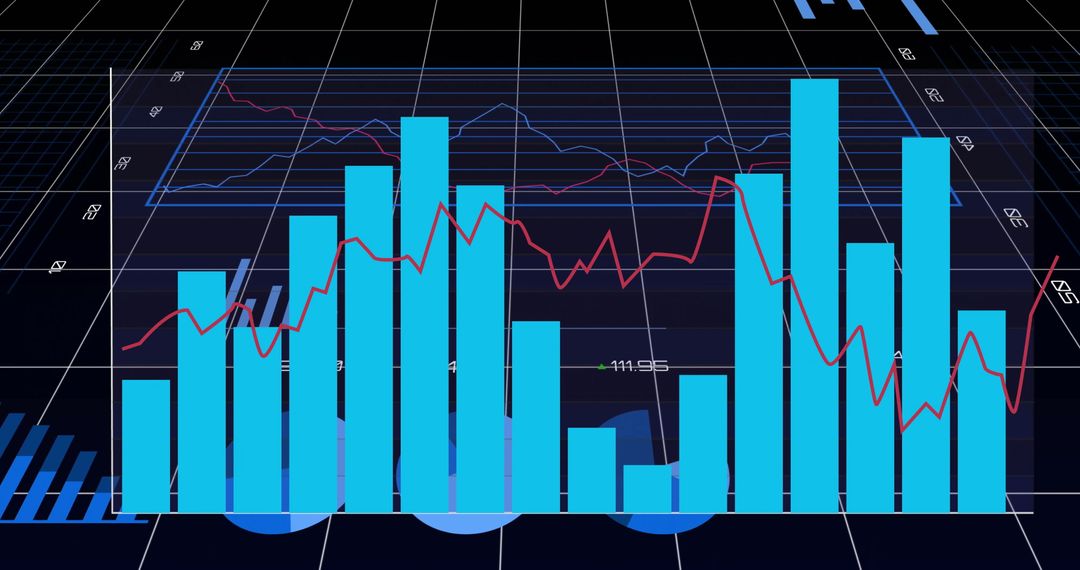
- Financial Trading Dashboard with Bar and Line Graphs
Financial Trading Dashboard with Bar and Line Graphs Image
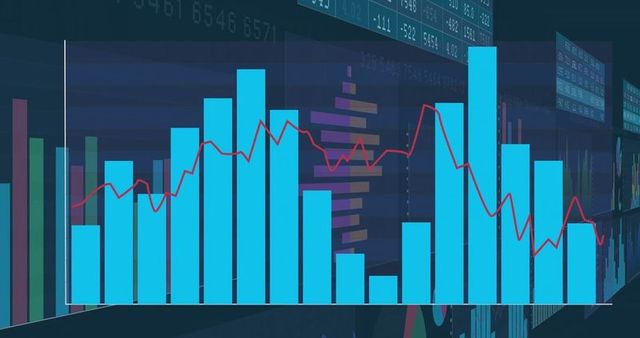
Illustration of a financial dashboard showcasing blue bar graphs and a red line graph. Depiction of data analysis on a trading monitor with detailed analytics visuals in the background. Purple bars add a layer of complexity, perfect for illustrating financial reports, investment analyses, or business strategy visuals.
Powered by  - Get 15% off with code: PIKWIZARD15


0
downloads
downloads
Tags:
More
Credit Photo
If you would like to credit the Photo, here are some ways you can do so
Text Link
photo Link
<span class="text-link">
<span>
<a target="_blank" href=https://pikwizard.com/photo/financial-trading-dashboard-with-bar-and-line-graphs/f03bfca1177e92fe71f46aca4de2db25/>PikWizard</a>
</span>
</span>
<span class="image-link">
<span
style="margin: 0 0 20px 0; display: inline-block; vertical-align: middle; width: 100%;"
>
<a
target="_blank"
href="https://pikwizard.com/photo/financial-trading-dashboard-with-bar-and-line-graphs/f03bfca1177e92fe71f46aca4de2db25/"
style="text-decoration: none; font-size: 10px; margin: 0;"
>
<img src="https://pikwizard.com/pw/medium/f03bfca1177e92fe71f46aca4de2db25.jpg" style="margin: 0; width: 100%;" alt="" />
<p style="font-size: 12px; margin: 0;">PikWizard</p>
</a>
</span>
</span>
Free (free of charge)
Free for personal and commercial use.
Author: Awesome Content
Similar Free Stock Images
Premium


Premium


Premium


Premium


Premium


Premium


Premium


Premium


Premium


Premium


Premium


Premium


Premium


Premium


Premium


Premium


Premium


Premium


Premium


Premium


Premium


Premium


Premium


Premium