
- Home >
- Stock Photos >
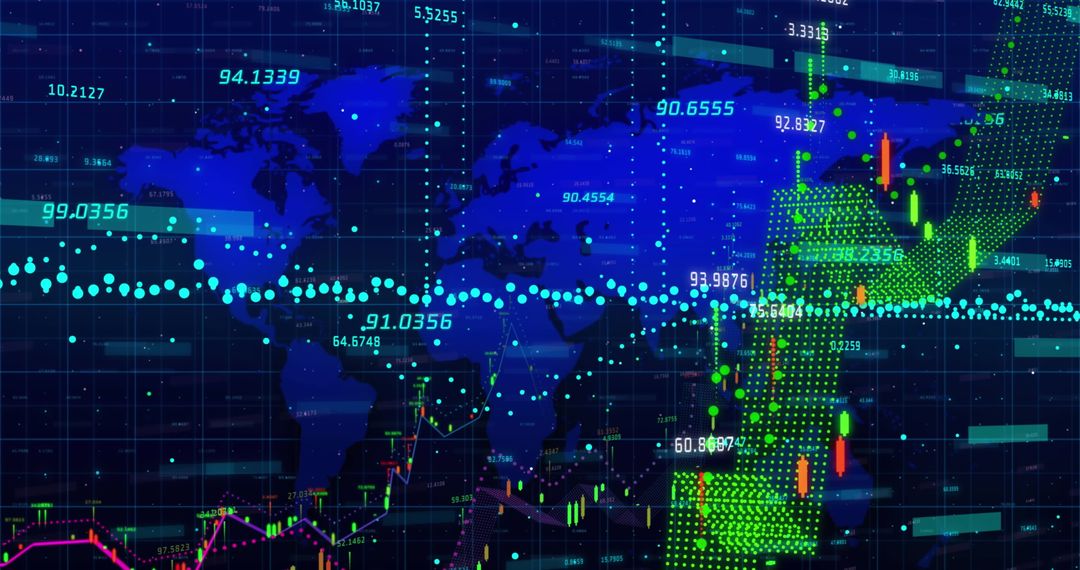
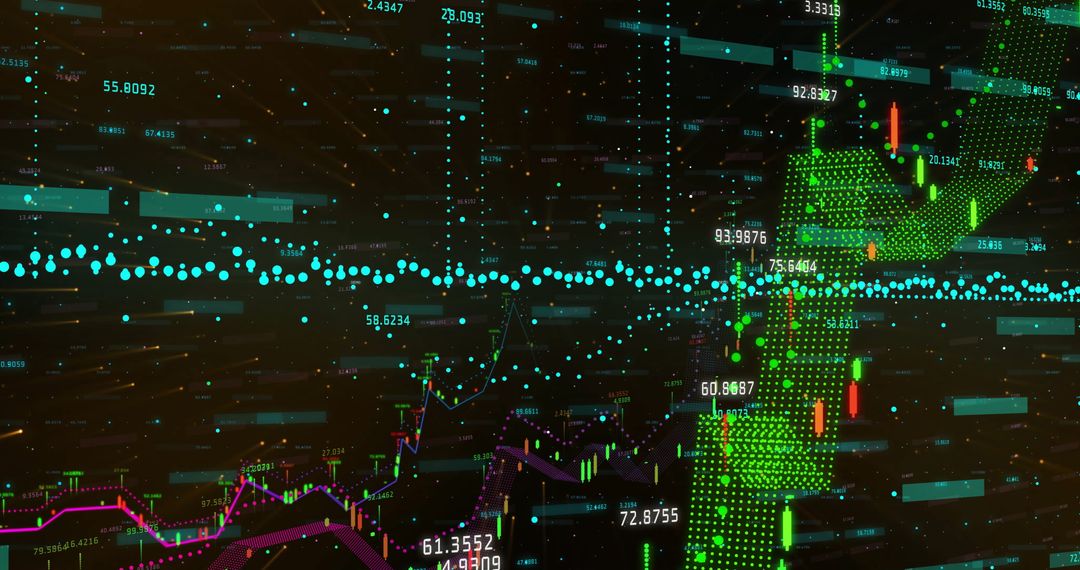
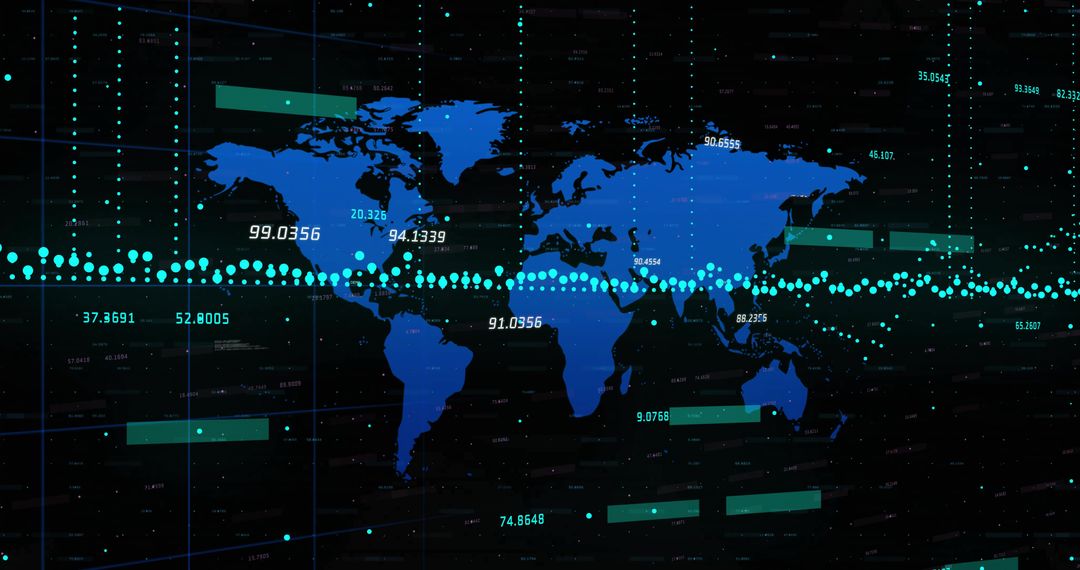
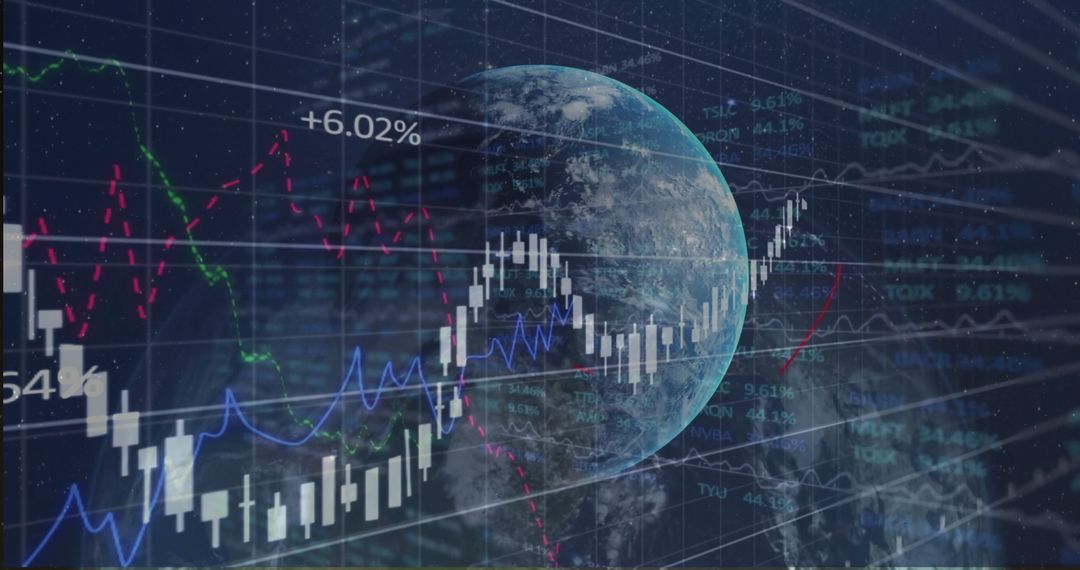
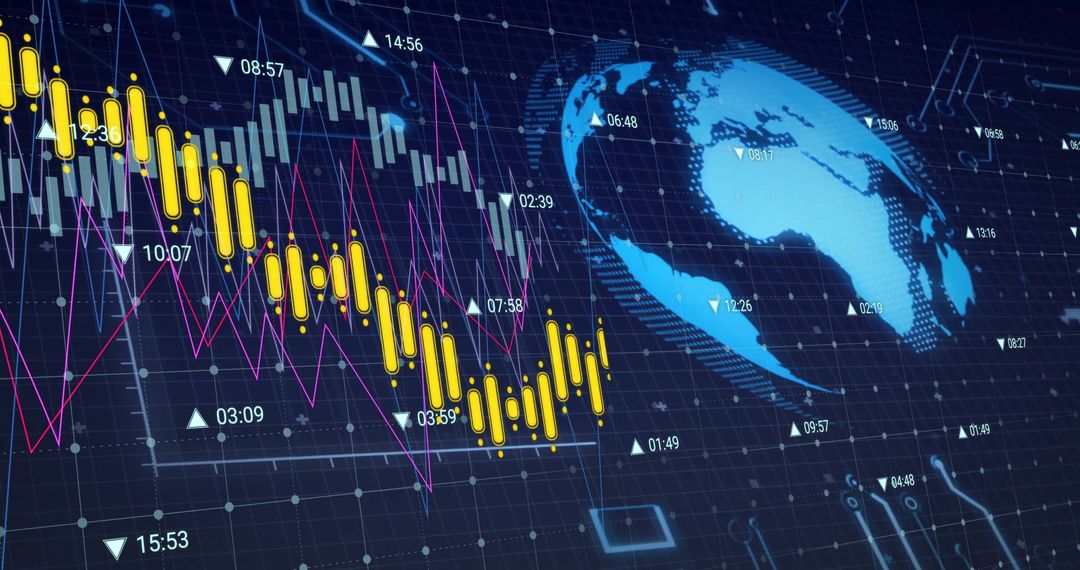
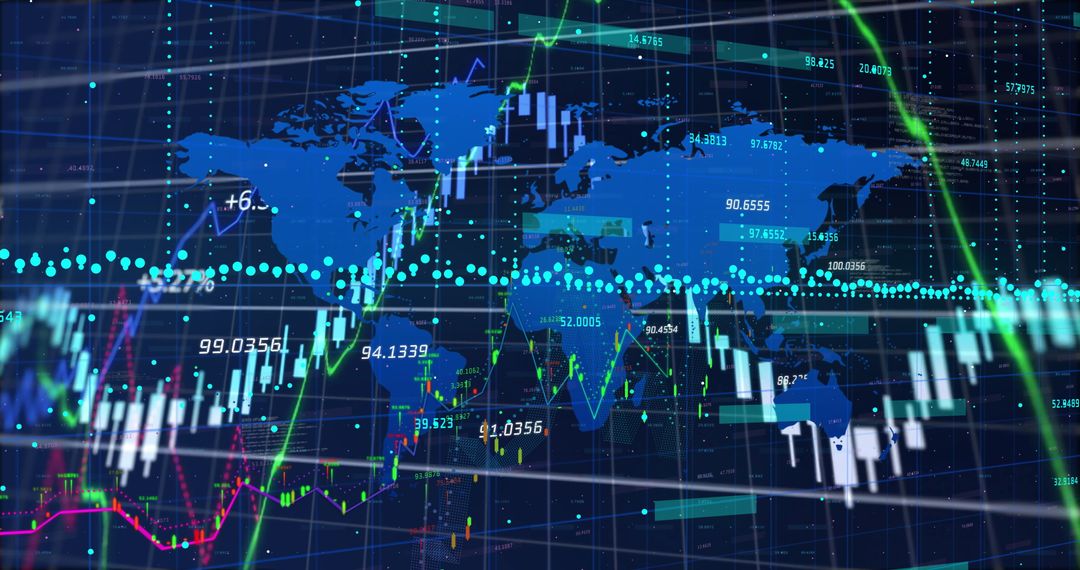
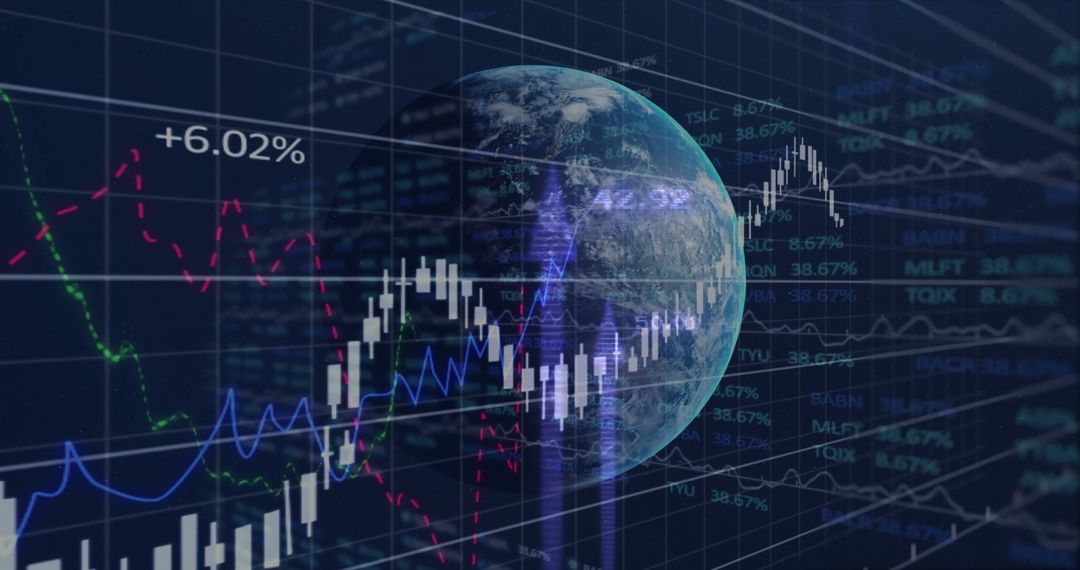
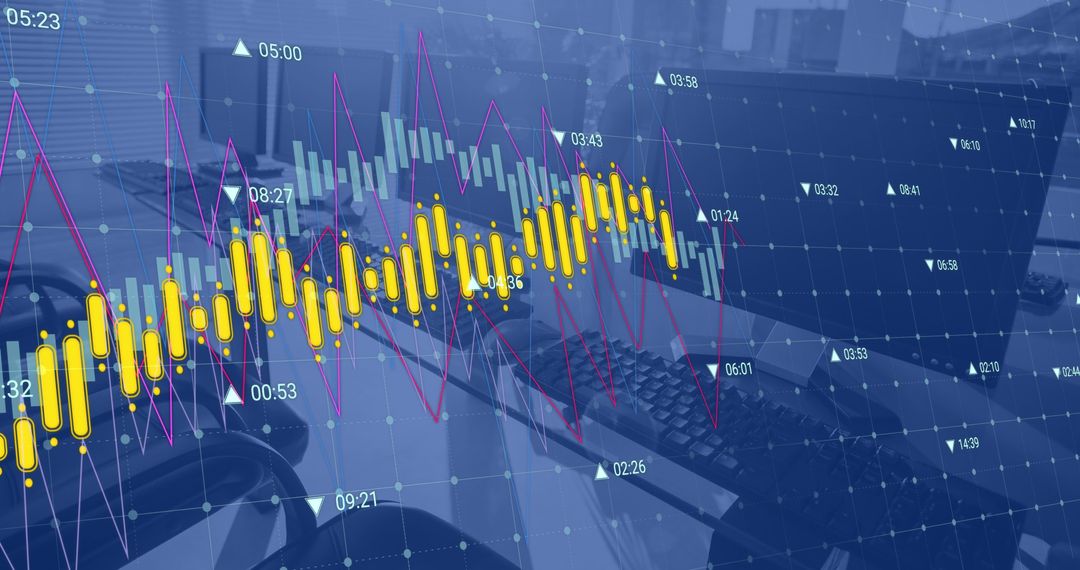
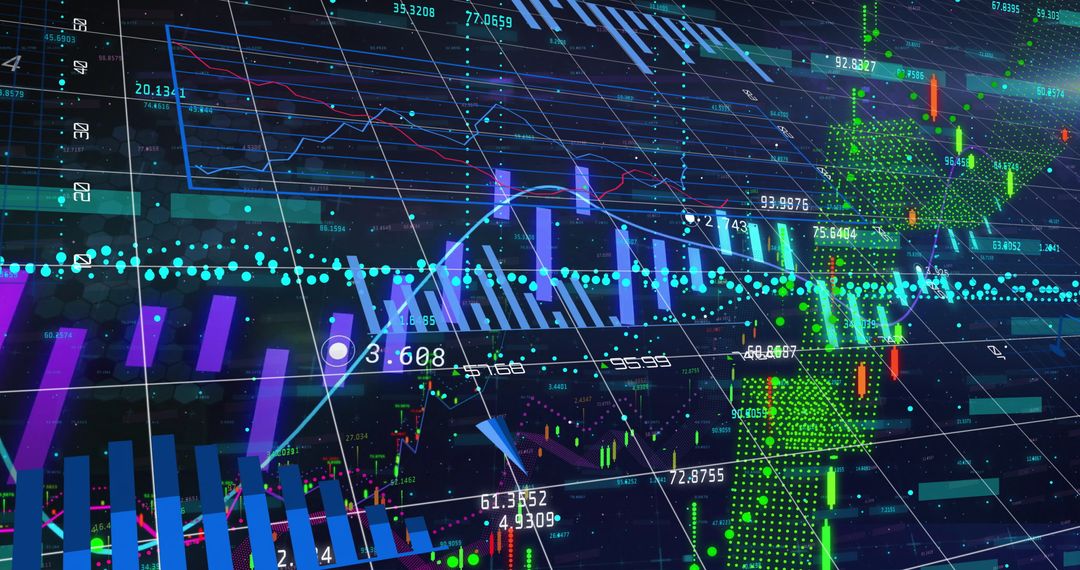
- Financial Trading Data with World Map and Candlestick Charts
Financial Trading Data with World Map and Candlestick Charts Image
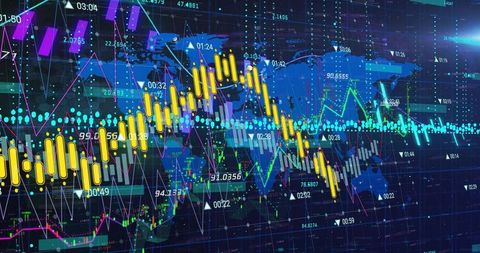
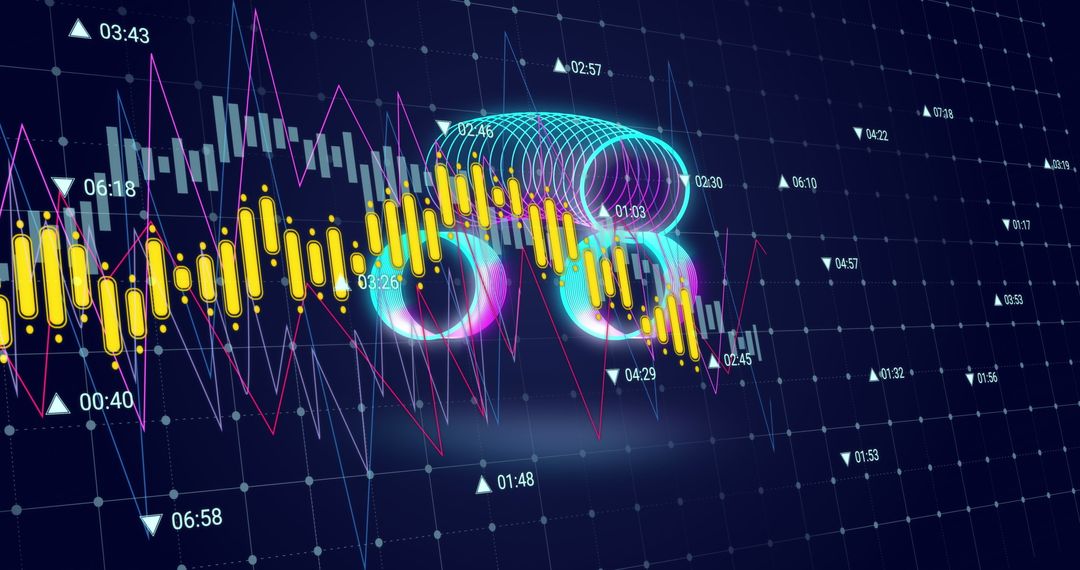
Sophisticated data interface showcasing yellow candlestick bars in a digital trading dashboard, overlaying a world map. Numeric labels and lines represent real-time stock market trends and latitudinal analysis are prevalent. Ideal for illustrating global investment strategies and analysis of financial markets. Useful for presentations, articles, or materials related to finance, technology, investment tips, and market trend predictions.
Powered by  - Get 15% off with code: PIKWIZARD15


0
downloads
downloads
Tags:
More
Credit Photo
If you would like to credit the Photo, here are some ways you can do so
Text Link
photo Link
<span class="text-link">
<span>
<a target="_blank" href=https://pikwizard.com/photo/financial-trading-data-with-world-map-and-candlestick-charts/c4a4a9354fc6592a9e80bcd5b34261c1/>PikWizard</a>
</span>
</span>
<span class="image-link">
<span
style="margin: 0 0 20px 0; display: inline-block; vertical-align: middle; width: 100%;"
>
<a
target="_blank"
href="https://pikwizard.com/photo/financial-trading-data-with-world-map-and-candlestick-charts/c4a4a9354fc6592a9e80bcd5b34261c1/"
style="text-decoration: none; font-size: 10px; margin: 0;"
>
<img src="https://pikwizard.com/pw/medium/c4a4a9354fc6592a9e80bcd5b34261c1.jpg" style="margin: 0; width: 100%;" alt="" />
<p style="font-size: 12px; margin: 0;">PikWizard</p>
</a>
</span>
</span>
Free (free of charge)
Free for personal and commercial use.
Author: People Creations
Similar Free Stock Images

Premium


Premium


Premium


Premium


Premium


Premium


Premium


Premium


Premium


Premium


Premium


Premium


Premium


Premium


Premium


Premium


Premium


Premium


Premium


Premium


Premium


Premium


Premium


Premium

