- Home >
- Stock Photos >
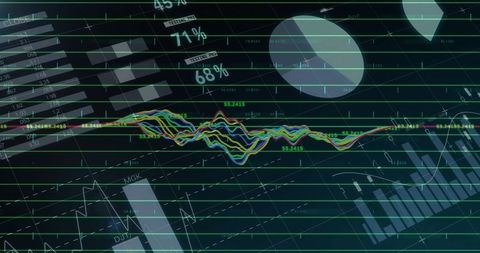
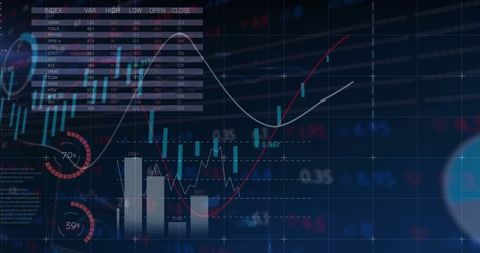
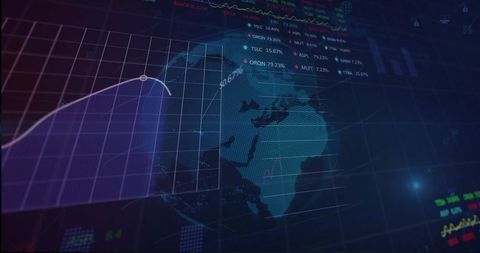
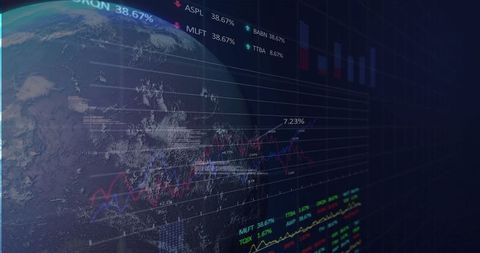
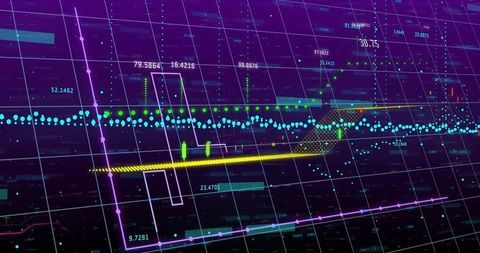
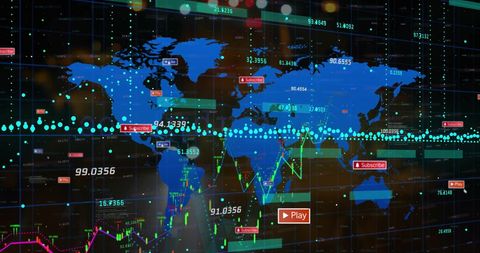
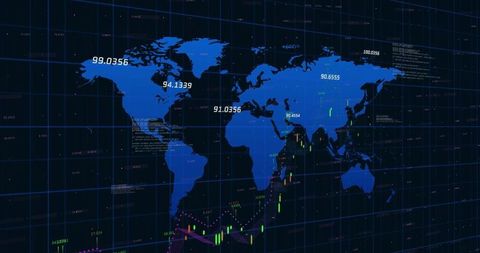
- Financial Trading Terminal with Dynamic Data Visualization
Financial Trading Terminal with Dynamic Data Visualization Image

This digital representation of a trading terminal displays a candlestick chart accompanied by line plots and percentage labels, illustrating real-time financial data and analysis. It is useful for presentations on stock market strategies, investment analysis, and illustrating economic trends. Perfect for financial publications and marketing materials related to investment products.

downloads
Tags:
More
Credit Photo
If you would like to credit the Photo, here are some ways you can do so
Text Link
photo Link
<span class="text-link">
<span>
<a target="_blank" href=https://pikwizard.com/photo/financial-trading-terminal-with-dynamic-data-visualization/b603e5e8b768b0d153a9877358872b1b/>PikWizard</a>
</span>
</span>
<span class="image-link">
<span
style="margin: 0 0 20px 0; display: inline-block; vertical-align: middle; width: 100%;"
>
<a
target="_blank"
href="https://pikwizard.com/photo/financial-trading-terminal-with-dynamic-data-visualization/b603e5e8b768b0d153a9877358872b1b/"
style="text-decoration: none; font-size: 10px; margin: 0;"
>
<img src="https://pikwizard.com/pw/medium/b603e5e8b768b0d153a9877358872b1b.jpg" style="margin: 0; width: 100%;" alt="" />
<p style="font-size: 12px; margin: 0;">PikWizard</p>
</a>
</span>
</span>
Free (free of charge)
Free for personal and commercial use.
Author: Awesome Content