
- Home >
- Stock Photos >
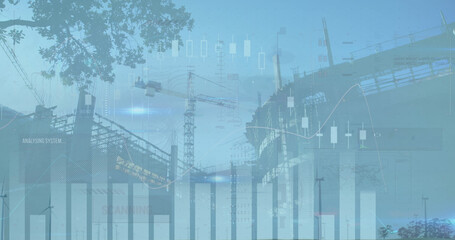
- Financial Trends Amid Urban Construction Digital Interface
Financial Trends Amid Urban Construction Digital Interface Image

Conceptual representation of financial market data overlaying a construction site backdrop symbolizes interplay of economic trends with urban development. Useful in illustrating financial growth, construction industry analysis, or futuristic economy themes for reports, presentations, and industry insights.
Powered by 


2
downloads
downloads
Tags:
More
Credit Photo
If you would like to credit the Photo, here are some ways you can do so
Text Link
photo Link
<span class="text-link">
<span>
<a target="_blank" href=https://pikwizard.com/photo/financial-trends-amid-urban-construction-digital-interface/d2d71a5857207576e2c0ae7e6dd40e0f/>PikWizard</a>
</span>
</span>
<span class="image-link">
<span
style="margin: 0 0 20px 0; display: inline-block; vertical-align: middle; width: 100%;"
>
<a
target="_blank"
href="https://pikwizard.com/photo/financial-trends-amid-urban-construction-digital-interface/d2d71a5857207576e2c0ae7e6dd40e0f/"
style="text-decoration: none; font-size: 10px; margin: 0;"
>
<img src="https://pikwizard.com/pw/medium/d2d71a5857207576e2c0ae7e6dd40e0f.jpg" style="margin: 0; width: 100%;" alt="" />
<p style="font-size: 12px; margin: 0;">PikWizard</p>
</a>
</span>
</span>
Free (free of charge)
Free for personal and commercial use.
Author: People Creations
Similar Free Stock Images
Loading...

Premium


Premium


Premium


Premium
Premium


Premium


Premium


Premium


Premium


Premium


Premium


Premium

Premium


Premium

Premium

Premium


Premium


Premium


Premium


Premium


Premium


Premium


Premium


Premium


Premium


