- Home >
- Stock Photos >
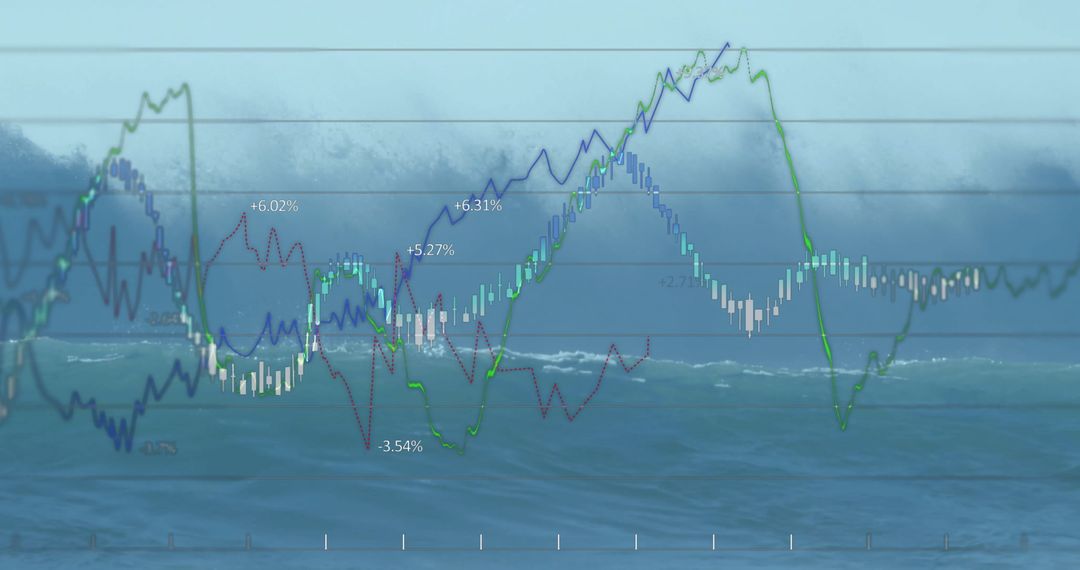
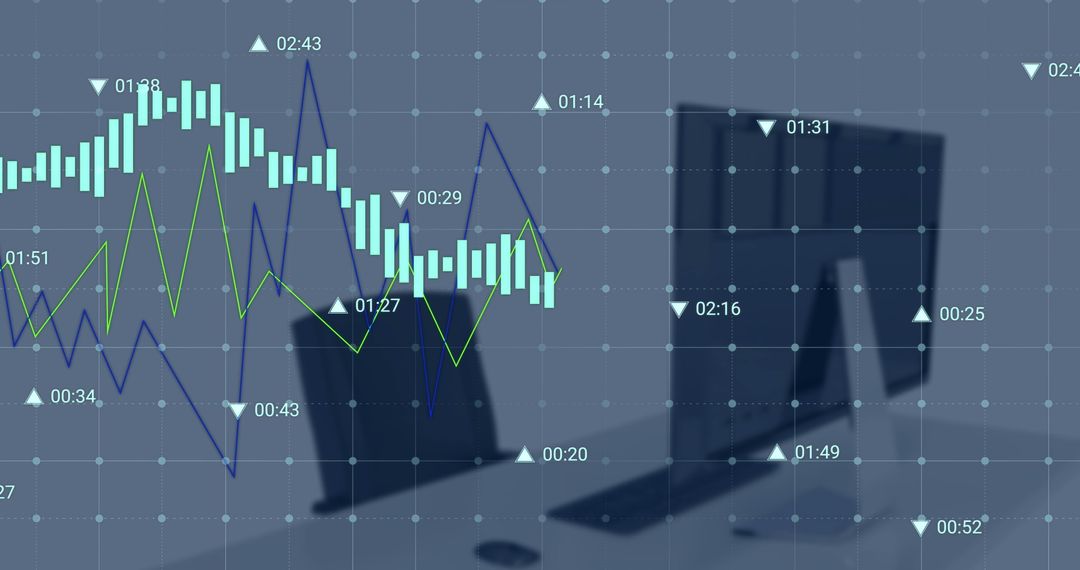
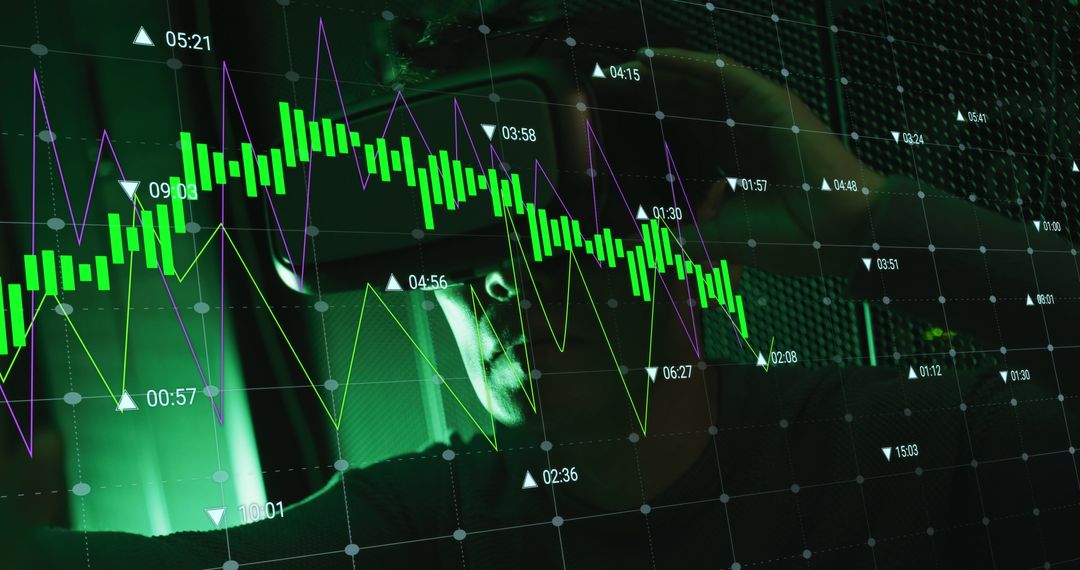
- Financial Trends and Analysis with Graphs Over Coins
Financial Trends and Analysis with Graphs Over Coins Image
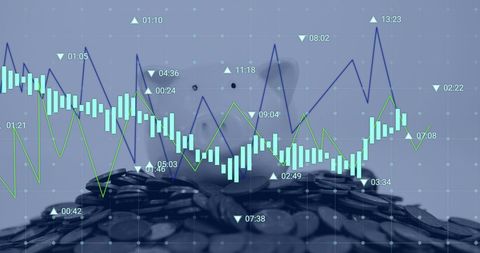
Visual representations highlight economic analysis with lines and figures. Ideal for illustrating financial and market forecasts, educational content about economic strategies, and investment trend reports.
Powered by 


2
downloads
downloads
Tags:
More
Credit Photo
If you would like to credit the Photo, here are some ways you can do so
Text Link
photo Link
<span class="text-link">
<span>
<a target="_blank" href=https://pikwizard.com/photo/financial-trends-and-analysis-with-graphs-over-coins/2894206d735ca3ece3824ddc13c6a4b6/>PikWizard</a>
</span>
</span>
<span class="image-link">
<span
style="margin: 0 0 20px 0; display: inline-block; vertical-align: middle; width: 100%;"
>
<a
target="_blank"
href="https://pikwizard.com/photo/financial-trends-and-analysis-with-graphs-over-coins/2894206d735ca3ece3824ddc13c6a4b6/"
style="text-decoration: none; font-size: 10px; margin: 0;"
>
<img src="https://pikwizard.com/pw/medium/2894206d735ca3ece3824ddc13c6a4b6.jpg" style="margin: 0; width: 100%;" alt="" />
<p style="font-size: 12px; margin: 0;">PikWizard</p>
</a>
</span>
</span>
Free (free of charge)
Free for personal and commercial use.
Author: Authentic Images
Similar Free Stock Images

Premium


Premium


Premium


Premium


Premium


Premium


Premium


Premium


Premium


Premium


Premium


Premium


Premium


Premium


Premium


Premium


Premium


Premium


Premium


Premium


Premium


Premium


Premium


Premium