- Home >
- Stock Photos >
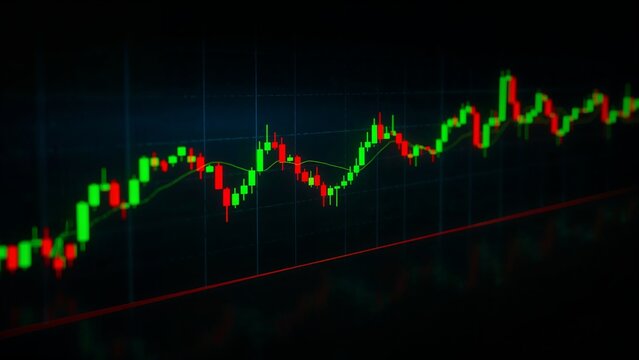
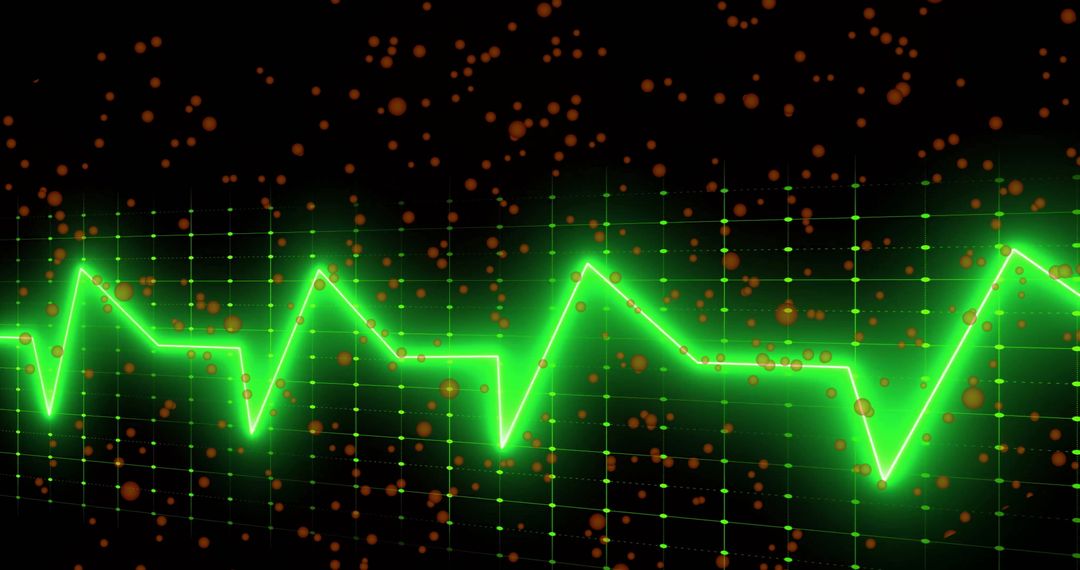
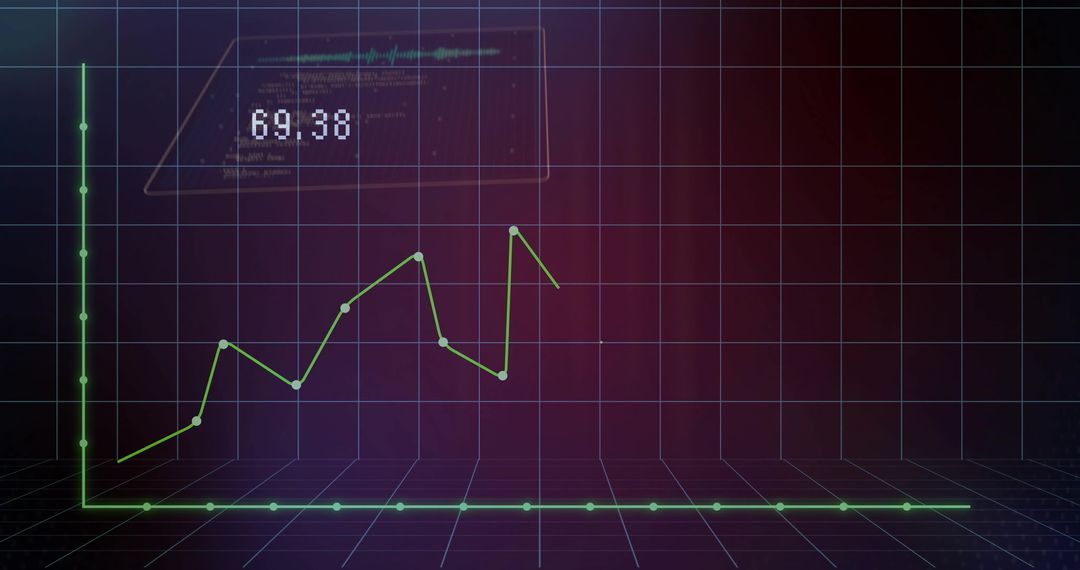
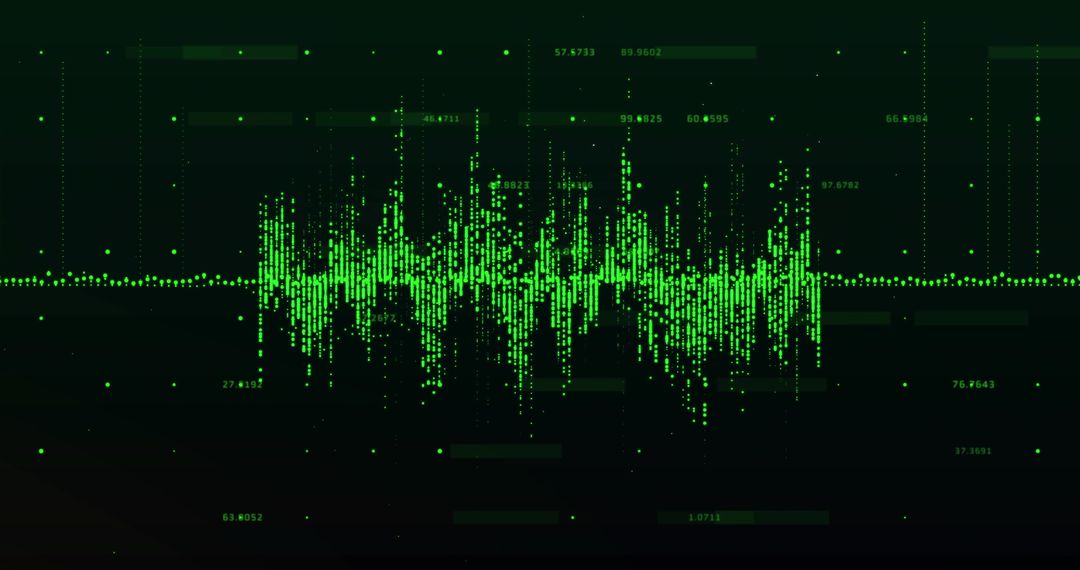
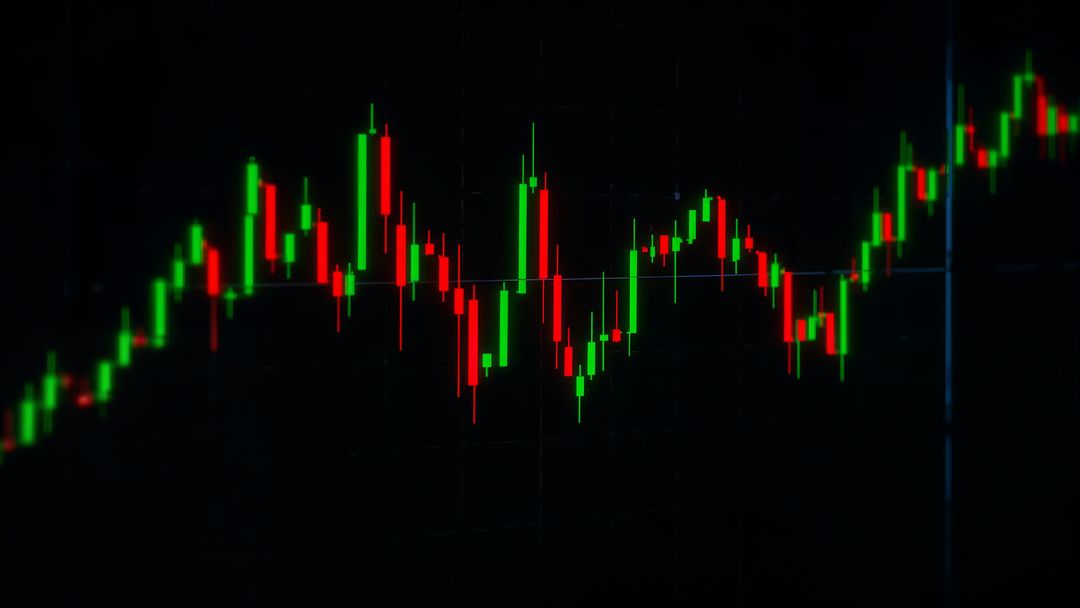
- Fintech Candlestick Chart with Trendline and Moving Averages
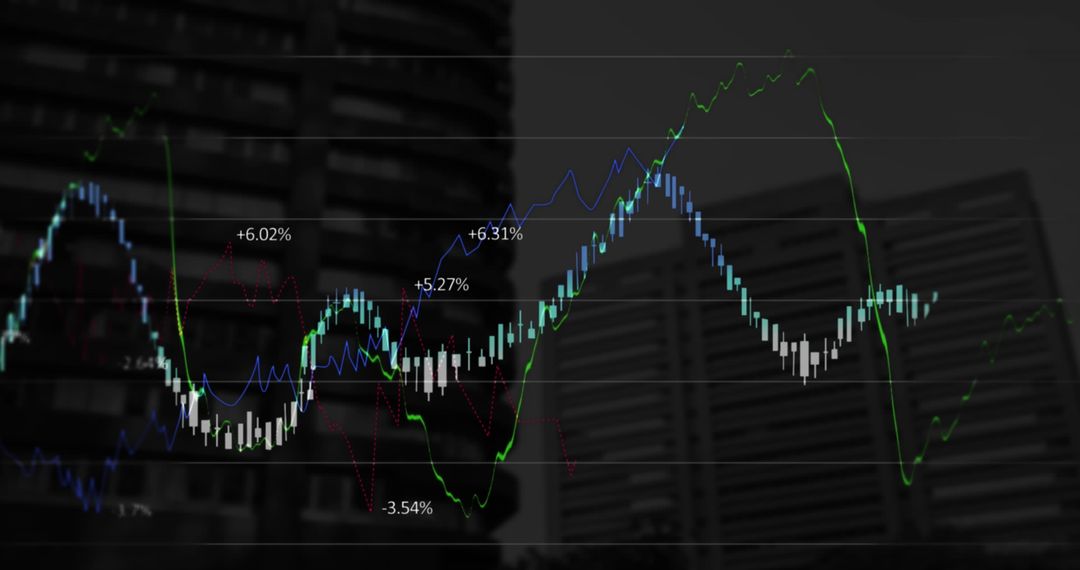
Fintech Candlestick Chart with Trendline and Moving Averages Image
AI Generated Image. Abstract representation of market trends using red and green candlesticks on a digital grid. This illustration effectively highlights changing market dynamics, with a notable trendline guiding the fluctuations. Useful for financial presentations, economic research, fintech product demonstrations, and educational content on stock market analysis.
Powered by 


0
downloads
downloads
Tags:
More
Credit Photo
If you would like to credit the Photo, here are some ways you can do so
Text Link
photo Link
<span class="text-link">
<span>
<a target="_blank" href=https://pikwizard.com/photo/fintech-candlestick-chart-with-trendline-and-moving-averages/4d5f774b2dc22348e3e61b0380761b67/>PikWizard</a>
</span>
</span>
<span class="image-link">
<span
style="margin: 0 0 20px 0; display: inline-block; vertical-align: middle; width: 100%;"
>
<a
target="_blank"
href="https://pikwizard.com/photo/fintech-candlestick-chart-with-trendline-and-moving-averages/4d5f774b2dc22348e3e61b0380761b67/"
style="text-decoration: none; font-size: 10px; margin: 0;"
>
<img src="https://pikwizard.com/pw/medium/4d5f774b2dc22348e3e61b0380761b67.jpg" style="margin: 0; width: 100%;" alt="" />
<p style="font-size: 12px; margin: 0;">PikWizard</p>
</a>
</span>
</span>
Free (free of charge)
Free for personal and commercial use.
Author: AI Creator
Similar Free Stock Images
Premium


Premium


Premium