
- Home >
- Stock Photos >
- Floating Financial Charts on Virtual Interface Representing Data Analysis
Floating Financial Charts on Virtual Interface Representing Data Analysis Image
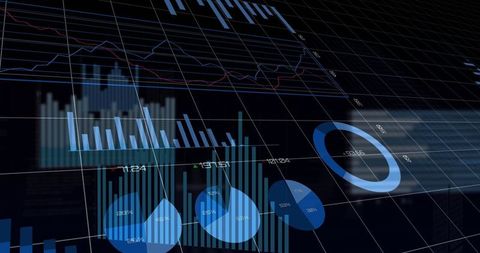
Digital finance concept depicting floating charts, providing a comprehensive visual representation of data. Suitable for presentations on finance analytics, technology advancements, data management dashboards, or business strategy development. Ideal for illustrating innovations in digital transformation scenarios.
Powered by 


downloads
Tags:
More
Credit Photo
If you would like to credit the Photo, here are some ways you can do so
Text Link
photo Link
<span class="text-link">
<span>
<a target="_blank" href=https://pikwizard.com/photo/floating-financial-charts-on-virtual-interface-representing-data-analysis/c40733f8cf63e97c4077e49b79a42daa/>PikWizard</a>
</span>
</span>
<span class="image-link">
<span
style="margin: 0 0 20px 0; display: inline-block; vertical-align: middle; width: 100%;"
>
<a
target="_blank"
href="https://pikwizard.com/photo/floating-financial-charts-on-virtual-interface-representing-data-analysis/c40733f8cf63e97c4077e49b79a42daa/"
style="text-decoration: none; font-size: 10px; margin: 0;"
>
<img src="https://pikwizard.com/pw/medium/c40733f8cf63e97c4077e49b79a42daa.jpg" style="margin: 0; width: 100%;" alt="" />
<p style="font-size: 12px; margin: 0;">PikWizard</p>
</a>
</span>
</span>
Free (free of charge)
Free for personal and commercial use.
Author: Authentic Images