- Home >
- Stock Photos >
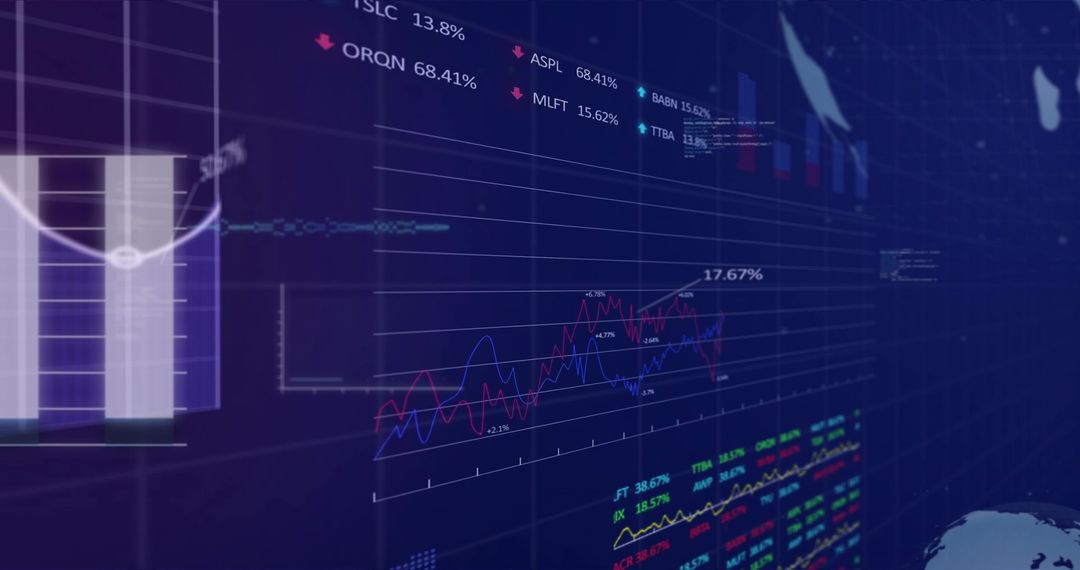
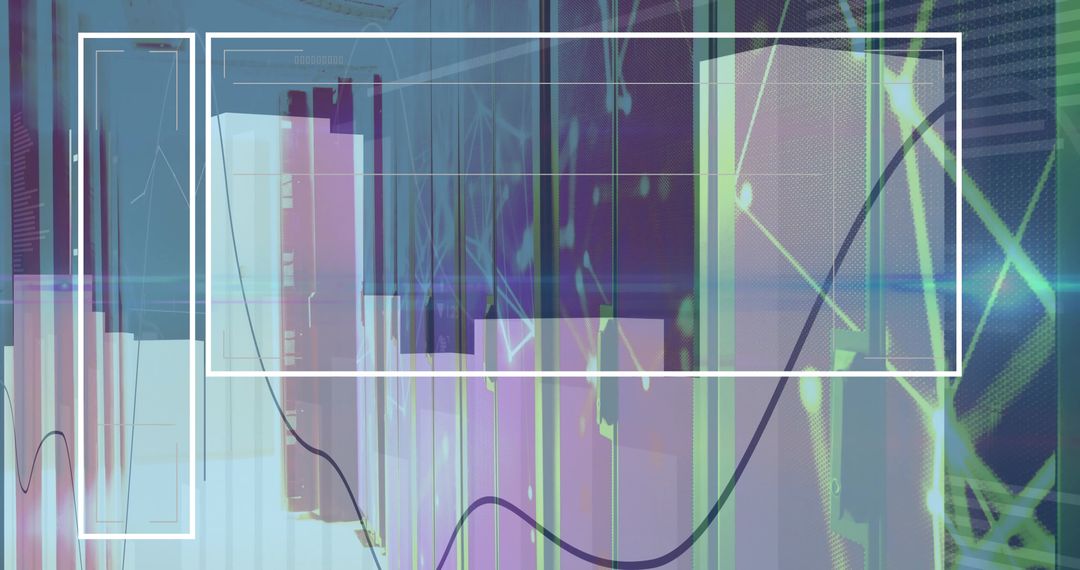
- Floating Holographic Data Dashboards with Neon Line and Bar Graphs in Dark Virtual Space
Floating Holographic Data Dashboards with Neon Line and Bar Graphs in Dark Virtual Space Image

AI Generated Image. Featuring floating translucent dashboards with neon blue and purple line and bar charts, conveying data growth, volatility, and predictive analytics. High-contrast dark background creating depth and focus for overlaying text, logos, or UI elements. Ideal for elevating fintech websites, AI and data science presentations, investor pitch decks, financial reports, and marketing campaigns. Providing ready-made visual for hero banners, social media posts, blog headers, slide decks, and app interfaces. Delivering modern, futuristic aesthetic for brand campaigns, editorial spreads, and technology product launches.
Powered by  - Get 15% off with code: PIKWIZARD15


0
downloads
downloads
Tags:
More
Credit Photo
If you would like to credit the Photo, here are some ways you can do so
Text Link
photo Link
<span class="text-link">
<span>
<a target="_blank" href=https://pikwizard.com/photo/floating-holographic-data-dashboards-with-neon-line-and-bar-graphs-in-dark-virtual-space/d9b138d7cd95ed7644f59ae0fb6da338/>PikWizard</a>
</span>
</span>
<span class="image-link">
<span
style="margin: 0 0 20px 0; display: inline-block; vertical-align: middle; width: 100%;"
>
<a
target="_blank"
href="https://pikwizard.com/photo/floating-holographic-data-dashboards-with-neon-line-and-bar-graphs-in-dark-virtual-space/d9b138d7cd95ed7644f59ae0fb6da338/"
style="text-decoration: none; font-size: 10px; margin: 0;"
>
<img src="https://pikwizard.com/pw/medium/d9b138d7cd95ed7644f59ae0fb6da338.jpg" style="margin: 0; width: 100%;" alt="" />
<p style="font-size: 12px; margin: 0;">PikWizard</p>
</a>
</span>
</span>
Free (free of charge)
Free for personal and commercial use.
Author: AI Creator
Similar Free Stock Images

Premium


Premium


Premium


Premium


Premium


Premium


Premium


Premium


Premium


Premium


Premium


Premium


Premium


Premium


Premium


Premium


Premium


Premium


Premium


Premium


Premium


Premium


Premium


Premium