
- Home >
- Stock Photos >
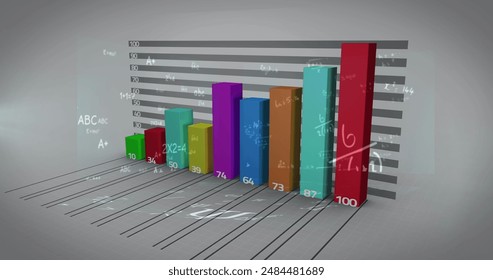
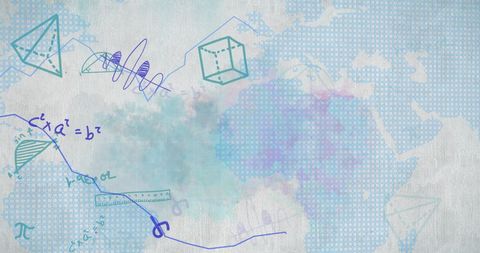
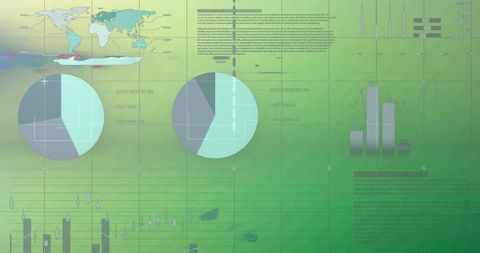
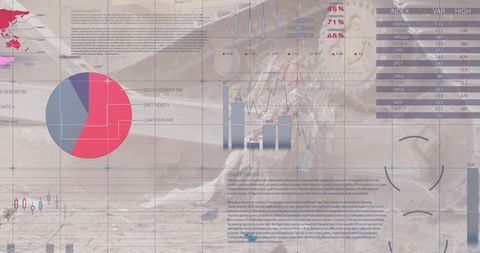
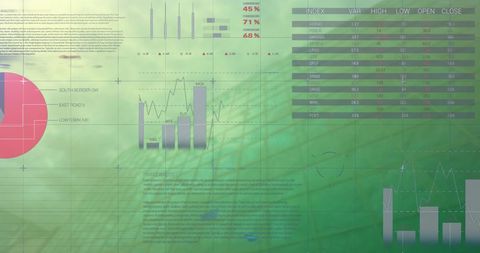
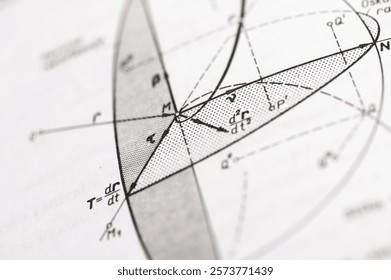
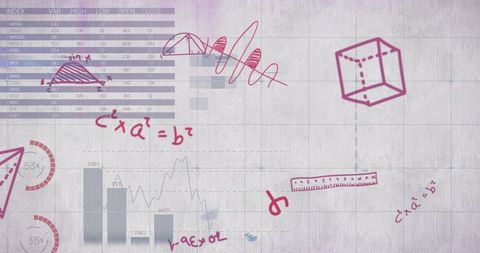
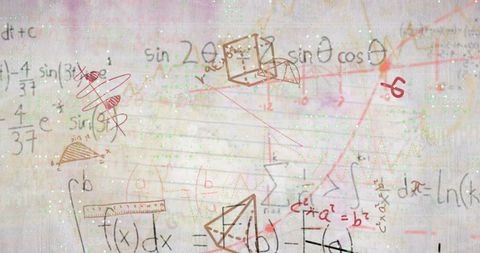
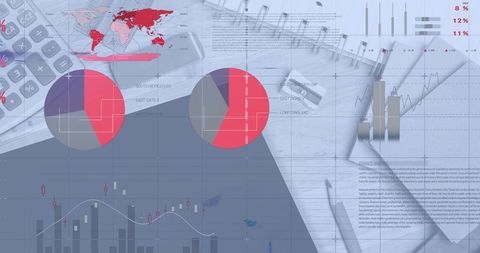
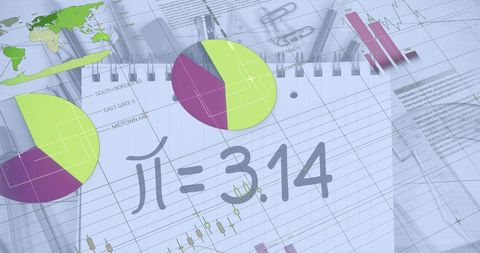
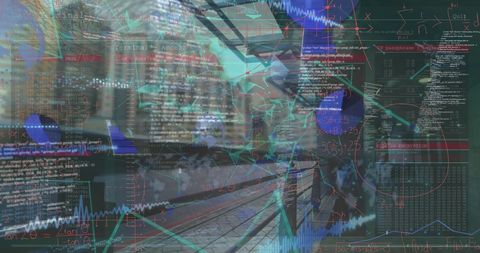
- Floating Mathematical Equations and Data Graphs in Abstract Background
Floating Mathematical Equations and Data Graphs in Abstract Background Image
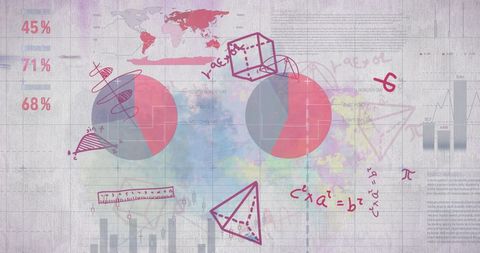
Mathematical equations and data processing diagrams are suspended against an abstract background, creating a dynamic visual concept. Ideal for educational content, e-learning materials, or illustrating articles about data science, mathematics, or technology. Suitable for presentations, infographics, and distance learning modules.
Powered by  - Get 15% off with code: PIKWIZARD15


downloads
Tags:
More
Credit Photo
If you would like to credit the Photo, here are some ways you can do so
Text Link
photo Link
<span class="text-link">
<span>
<a target="_blank" href=https://pikwizard.com/photo/floating-mathematical-equations-and-data-graphs-in-abstract-background/3ad76e32e3370405b636b2cb183d6ce7/>PikWizard</a>
</span>
</span>
<span class="image-link">
<span
style="margin: 0 0 20px 0; display: inline-block; vertical-align: middle; width: 100%;"
>
<a
target="_blank"
href="https://pikwizard.com/photo/floating-mathematical-equations-and-data-graphs-in-abstract-background/3ad76e32e3370405b636b2cb183d6ce7/"
style="text-decoration: none; font-size: 10px; margin: 0;"
>
<img src="https://pikwizard.com/pw/medium/3ad76e32e3370405b636b2cb183d6ce7.jpg" style="margin: 0; width: 100%;" alt="" />
<p style="font-size: 12px; margin: 0;">PikWizard</p>
</a>
</span>
</span>
Free (free of charge)
Free for personal and commercial use.
Author: People Creations
Similar Free Stock Images

Premium

Premium

Premium


Premium


Premium

Premium


Premium


Premium


Premium
Premium


Premium


Premium


Premium

Premium


Premium


Premium


Premium


Premium


Premium


Premium


Premium


Premium


Premium


Premium


Premium
Explore More Free Stock Images