
- Home >
- Stock Photos >
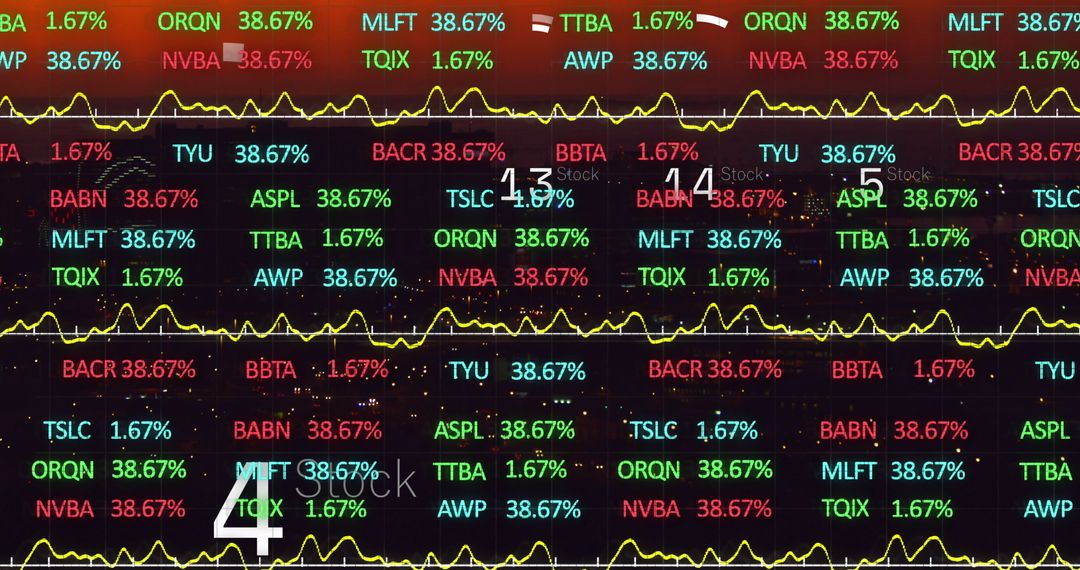
- Floating Numbers over Stock Market Data Visualization
Floating Numbers over Stock Market Data Visualization Image

Conceptual visualization of floating numbers over a backdrop of stock market and statistical data. Includes various indices and figures representing economic data analysis. Useful for illustrating financial analyses, economic reports, market forecasts, and corporate presentations related to global business performance and technological advancements in finance.
Powered by  - Get 15% off with code: PIKWIZARD15


2
downloads
downloads
Tags:
More
Credit Photo
If you would like to credit the Photo, here are some ways you can do so
Text Link
photo Link
<span class="text-link">
<span>
<a target="_blank" href=https://pikwizard.com/photo/floating-numbers-over-stock-market-data-visualization/612040b7eeab83c43b5e443898a52e05/>PikWizard</a>
</span>
</span>
<span class="image-link">
<span
style="margin: 0 0 20px 0; display: inline-block; vertical-align: middle; width: 100%;"
>
<a
target="_blank"
href="https://pikwizard.com/photo/floating-numbers-over-stock-market-data-visualization/612040b7eeab83c43b5e443898a52e05/"
style="text-decoration: none; font-size: 10px; margin: 0;"
>
<img src="https://pikwizard.com/pw/medium/612040b7eeab83c43b5e443898a52e05.jpg" style="margin: 0; width: 100%;" alt="" />
<p style="font-size: 12px; margin: 0;">PikWizard</p>
</a>
</span>
</span>
Free (free of charge)
Free for personal and commercial use.
Author: People Creations
Similar Free Stock Images

Premium


Premium


Premium


Premium


Premium


Premium


Premium


Premium


Premium


Premium


Premium


Premium


Premium


Premium


Premium


Premium


Premium


Premium


Premium


Premium


Premium


Premium


Premium


Premium
