- Home >
- Stock Photos >
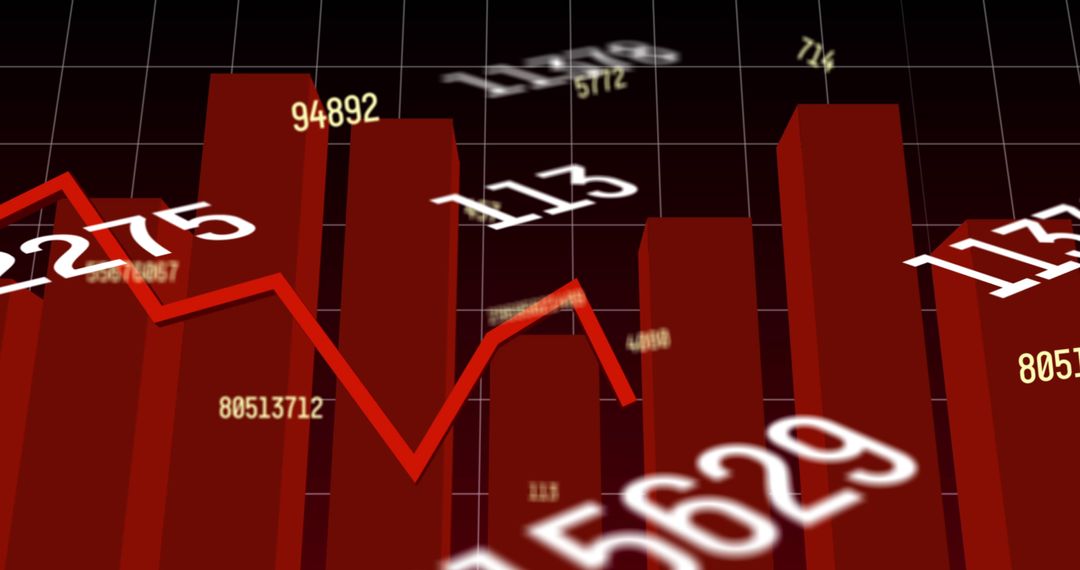
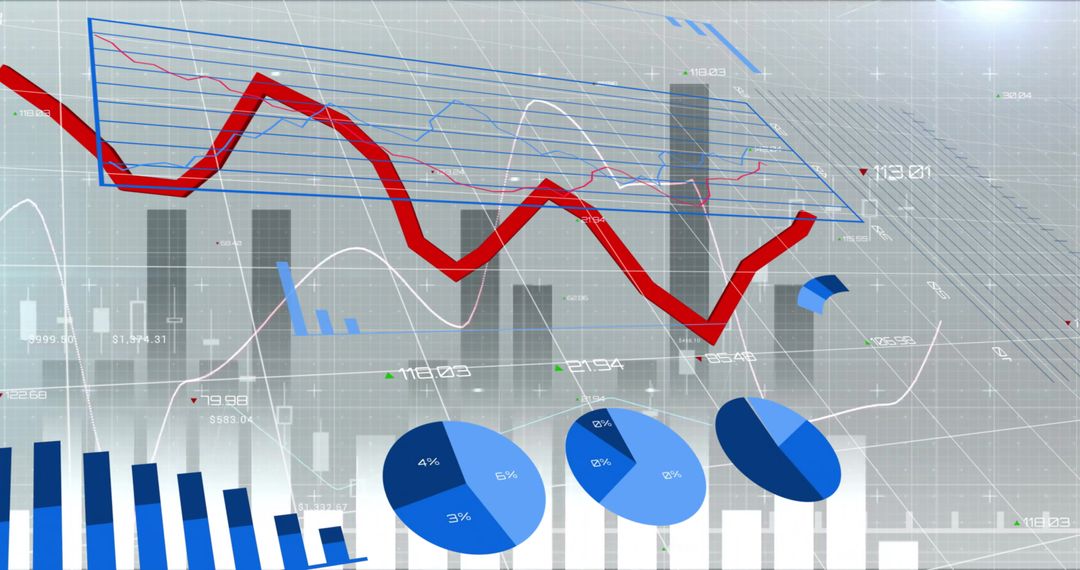
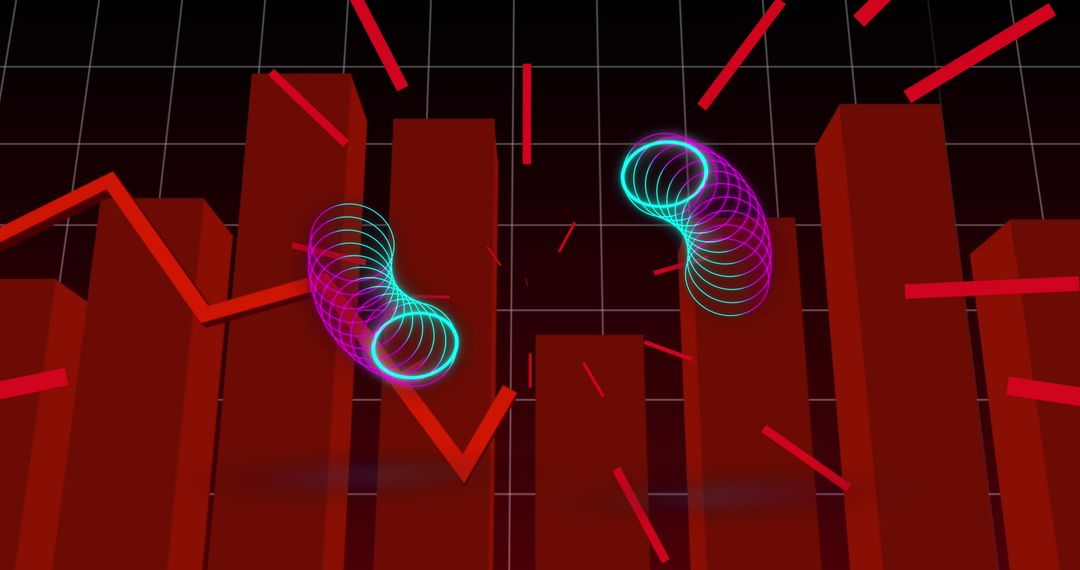
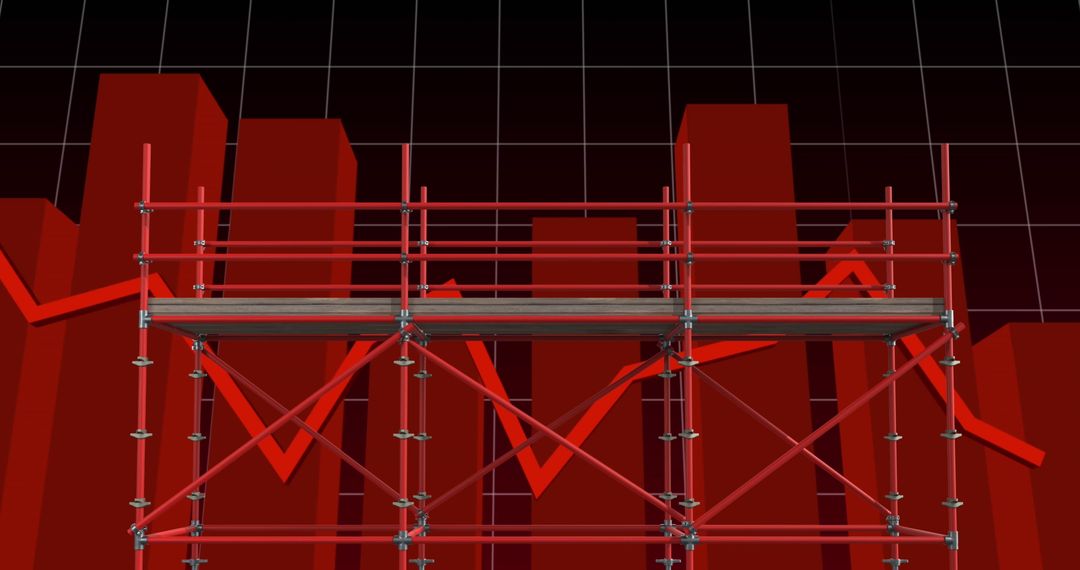
- Fluctuating Financial Graph with Red Trend Line Display
Fluctuating Financial Graph with Red Trend Line Display Image

Depicting financial fluctuations, this visualization can be ideal for presentations on economic trends, financial forecasting, and market analysis. Suitable for use in business reports, economic research papers, or investor newsletters to visually emphasize changes in business performance or financial metrics.
Powered by 


2
downloads
downloads
Tags:
More
Credit Photo
If you would like to credit the Photo, here are some ways you can do so
Text Link
photo Link
<span class="text-link">
<span>
<a target="_blank" href=https://pikwizard.com/photo/fluctuating-financial-graph-with-red-trend-line-display/230409d69fe88738690808b1acc3ed03/>PikWizard</a>
</span>
</span>
<span class="image-link">
<span
style="margin: 0 0 20px 0; display: inline-block; vertical-align: middle; width: 100%;"
>
<a
target="_blank"
href="https://pikwizard.com/photo/fluctuating-financial-graph-with-red-trend-line-display/230409d69fe88738690808b1acc3ed03/"
style="text-decoration: none; font-size: 10px; margin: 0;"
>
<img src="https://pikwizard.com/pw/medium/230409d69fe88738690808b1acc3ed03.jpg" style="margin: 0; width: 100%;" alt="" />
<p style="font-size: 12px; margin: 0;">PikWizard</p>
</a>
</span>
</span>
Free (free of charge)
Free for personal and commercial use.
Author: Creative Art
Similar Free Stock Images

Premium


Premium


Premium


Premium


Premium


Premium


Premium


Premium


Premium


Premium


Premium


Premium


Premium


Premium


Premium


Premium


Premium


Premium


Premium


Premium


Premium


Premium