- Home >
- Stock Photos >
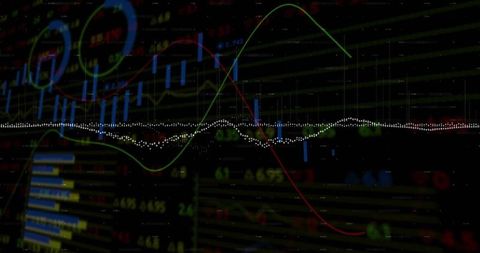
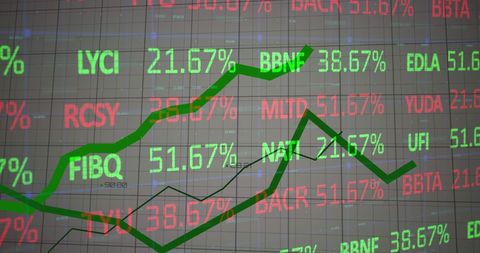
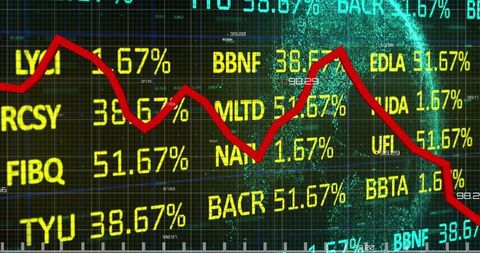
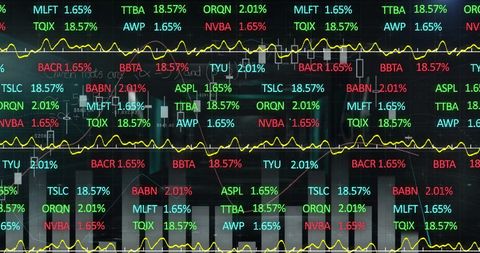
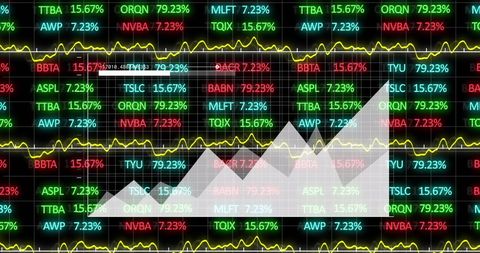
- Fluctuating Financial Stock Market with Digital Display
Fluctuating Financial Stock Market with Digital Display Image

Displays fluctuations in financial stock market data with a distinct red decline line amidst numbers and stock symbols. Can be used for illustrating financial articles, economic forecasts, market analysis reports, trading strategies, and educational materials about stock market trends.
Powered by 


2
downloads
downloads
Tags:
More
Credit Photo
If you would like to credit the Photo, here are some ways you can do so
Text Link
photo Link
<span class="text-link">
<span>
<a target="_blank" href=https://pikwizard.com/photo/fluctuating-financial-stock-market-with-digital-display/eea3e89027b577a2c7543ff5ede769ec/>PikWizard</a>
</span>
</span>
<span class="image-link">
<span
style="margin: 0 0 20px 0; display: inline-block; vertical-align: middle; width: 100%;"
>
<a
target="_blank"
href="https://pikwizard.com/photo/fluctuating-financial-stock-market-with-digital-display/eea3e89027b577a2c7543ff5ede769ec/"
style="text-decoration: none; font-size: 10px; margin: 0;"
>
<img src="https://pikwizard.com/pw/medium/eea3e89027b577a2c7543ff5ede769ec.jpg" style="margin: 0; width: 100%;" alt="" />
<p style="font-size: 12px; margin: 0;">PikWizard</p>
</a>
</span>
</span>
Free (free of charge)
Free for personal and commercial use.
Author: Creative Art
Similar Free Stock Images

Premium


Premium


Premium


Premium


Premium


Premium


Premium


Premium


Premium


Premium


Premium


Premium


Premium


Premium


Premium


Premium


Premium


Premium


Premium


Premium


Premium


Premium


Premium


Premium


Premium