1. Home > 
  2. Stock Photos > 
  3. Fluctuating Graph on Green Grid Background Illustrating Financial Trends

Fluctuating Graph on Green Grid Background Illustrating Financial Trends Image

Fluctuating Graph on Green Grid Background Illustrating Financial Trends

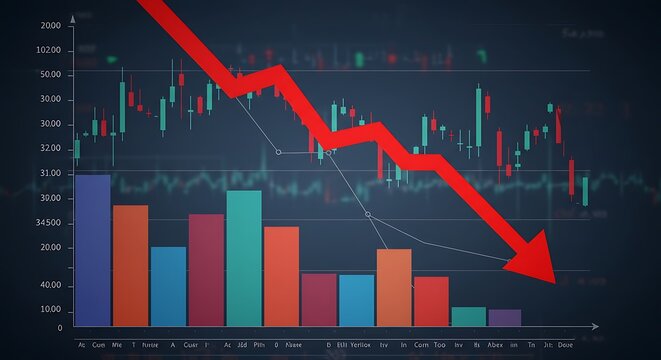
The image showcases a fluctuating red line graph on a green grid background, symbolizing financial market trends and statistical changes. It represents concepts such as economics, technology, and finance, beneficial for presentations or educational content related to business analyses, financial forecasting, or market reviews.

Powered by Adobe logo
Laptop screen displaying financial data charts. - Powered by AdobeDigital forex and stock market chart with upward arrows and glowing data on dark screen background showing financial growth trends. 3D Rendering - Powered by AdobeSmiling businessman standing at conference room near interactive board with charts and statistics and explaining his leadership team financial report. - Powered by AdobeInvestment and trade insights business analytics environment finance chart growth digital tablet viewpoint - Powered by AdobeA businessman holds a tablet displaying a rising financial graph and data - Powered by Adobe

Credit Photo

If you would like to credit the Photo, here are some ways you can do so

Free (free of charge)

Free for personal and commercial use.

Author: Creative Art

Similar Free Stock Images

Glowing Spotlight on Real-Time Financial Data Analysis
Premium
Financial data graph with rising and falling trends in vibrant colors
Digital Financial Data with Arrows Indicating Growth
Dynamic Financial Market Trends with Data Visualizations
World Map with Falling Line Graphs Indicating Global Economic Decline
Abstract Graph with Digital Blue and Orange Lines
Premium
Close-up of orange basketball on wood floor, blurred financial graph background, showcasing financial markets and sports business connection
Rising Digital Graph and Data Visualizations on Black Background
Digital Finance: Modern Stock Market Analysis Display
Financial Graph Analysis on Green Grid Background
Dynamic Financial Charts and Graphs Indicating Market Trends
Premium
Abstract representation of the united kingdom flag overlaid with a fluctuating financial market graph showing economic trends and data analysis
Dynamic Financial Graph with Rising Trend on Blue Background
Digital Financial Data and Global Market Analysis on Graph
Visual Display of Abstract Financial Data
Digital Analysis of Financial Data with Dynamic Graphs
Premium
The essential tools for financial analysis and business reporting on a desk.
Financial Graphs Overlay Virtual Data Office Computers
Abstract Financial Data Chart with Positive Trends and Percentages
Dynamic Financial Graphs and Data Analysis Interface
Dynamic Financial Data Graphs with Holographic Styles
Premium
Abstract financial stock market graph with candlestick bars isolated on transparent background
Dynamic Stock Market Analysis Concept Artwork
Dynamic Financial Data Overlaid on Grid Background
Fluctuating Financial Graph on Digital Orange Background
Armenian Flag with Financial Graph Overlay Depicting Market Trends
Premium
Sharp Stock Market Drop
Red Line Graph on Digital Grid Background for Analytics
Social Media Growth Metrics on Digital Dashboard Grid
Dynamic Financial Graph with Candlestick Patterns and Percentage Metrics
Futuristic Financial Dashboard with Analytics and Data Visualization
Red Declining Graph on Digital Grid Display Represents Falling Markets
Rising Stock Market Trend with Digital Data Analytics
Premium
Golden compass on financial data chart showing stock market trading graphs. Investment strategy, financial direction, business analysis, digital technology concept with sparkling lights, blue, red
Analyzing Graph Showing Market Economy Stock Crisis
Global Economic Trends Highlighted on World Map with Graphs
Digital Financial Graph with Rising Line Trend on Dark Background
Dynamic Line Chart with Histogram on Digital Grid Background
Premium
Financial market data analysis with glowing 3D bar and line charts on dark background showing economic trends and growth concept visualization. 3D Rendering
Fluctuating Digital Stock Market Data Chart
Rising Graphs Over Cityscape Illustrating Financial Growth
Social Media Activity Icons on Digital Graph
Rising Graphs and Interactive Financial Data Analytics Background
Premium
A businesswoman analyzes financial documents with charts and graphs at a desk, highlighting data trends with a pen in a bright, professional office setting.
Rising Financial Graph on Purple Background
Dynamic Forex Trading Graphs with Increasing Numbers
Financial Growth Graph and Data Analytics Representation
Dynamic Financial Data Visualization on Digital Grid Background
Premium
Visualizing Financial Growth A Hand Pointing at Rising Bar Graphs and Lines on a Blue Background Representing Market Trends and Economic Development with Clarity and Insight
Dynamic Financial Data Against Urban Skyline
Financial Data Graph Over Cityscape with Digital Overlay
Inflation Analytics: Graphic Representation of Stock Market Trends
Data Visualization on Digital Grid with Technological Interface
Premium
Medical analysis concept with stethoscope, business chart and laptop showing financial health
Fluctuating Financial Graph on Green Grid Background
Financial Graph with Data Analysis and Market Statistics
Fluctuating Stock Market Graph with Dramatic Peaks
Digital Stock Market Graph Red Trendline on Green Background
Premium
Futuristic bar graph on tablet symbolizing growth and success in the digital age
Trend Analysis with Candlestick Chart and Data Indicators
Dynamic Data Dashboard with Multicolored Trendlines and Chart Bars
Candlestick trading chart displaying trend lines, indicators and percentage labels
Digital Financial Data Chart with Modern City Skyscrapers
Dynamic Financial Data Graphs Networking in Global Business
Financial Data Analysis with Growth Trend Arrows on Digital Interface
Premium
Blue growth graph business chart data diagram on success financial presentation background
Financial Data Charts with World Map on Blue Digital Background
Fluctuating Financial Graph with Red Line on Green Grid
Falling Line Graph on Navy Background Illustrating Economic Decline
Financial Stock Market Data Analysis on Digital Interface
Premium
Row of suburban homes with financial graph overlay, representing real estate market trends.
Dynamic Data Graphs on Digital Interface Background
Dynamic Financial Growth Digital Chart Display
Holographic Financial Graph with Dynamic Line Chart
Dynamic Digital Market Analysis with Holographic Data
Premium
Financial growth chart with glowing line graph overlay on city skyscrapers at sunset, representing business success and economic progress.
Financial Data Analysis in Digital Interface with Graphs
Financial Graphs with Social Media Analytics on Digital Chart
Dynamic Data Chart on Dark Digital Background
Financial Data Graph Overlay on Modern Office Background
Premium
Data analysis and financial charts on futuristic screen for business growth
Financial Data with Fluctuating Graph Lines on Grid Background
Digital Cityscape with Financial Data Overlay
Financial Data Analysis Vibrant Graphs on Blue Background
Dynamic Red Line Graph Over Green Grid Background
Premium
Stock market graph with blue technology background, financial trading analysis chart, investment growth data visualization, economic business concept
Dynamic Stock Market Chart with Fluctuating Trends and Data Points
Dynamic Stock Market Analysis with Digital Graph Lines
Futuristic Analytics Graph with Cyan-Orange Line Trends
Dynamic Social Media Analytics with Zigzag Chart on Grid Background
Premium
Crimson Descent
Red Line Chart Trending Downward in Data Visualization
Glowing Neon Red Global Trend Line Chart Showing Market Fluctuations on Digital World Map
Falling Market Trend with Empty Classroom Background
Digital Financial Data and Global Business Analytics
Dynamic Graph with Vibrant Lines on Black Background
Dynamic Financial Graphs Over Cityscape Background
Premium
Magnifying glass focusing on candlestick chart, showcasing market analysis on a dark background, concept for financial review, investment strategy and business intelligence data analysis
Abstract Financial Graph on Dark Digital Background
Dynamic Financial Graphs Illustrating Market Trends
Dynamic Stock Market Data Visualization on Digital Screen
Financial Growth Chart Overlay on City Skyline
Premium
Glowing upward arrow graph made of digital particles, symbolizing growth and success on a dark background with bokeh lights.
Financial Market Growth Over City Skyline
Dynamic Financial Data Chart Display with Graphical Analysis
Financial Graphs Displaying Business Trends on Grid Background
Digital Financial Data Processing with Graphs and Charts
Premium
Smiling business woman uses tablet analyzing stock market data at night. Financial growth graphs, data trends overlaid on screen. Successful trader investor monitors investment performance on digital
Rising Financial Data Graph on Digital Grid Background
Tech-Focused Financial Data Visualization with Rising Graphs
Dynamic Lines Show Rising Financial Statistics Over Time
Dynamic Stock Market Visual in Modern Office Setting
Premium
glowing financial stock market chart with a rising arrow for business success, data analysis, and investment concepts
Data Visualization on Blue Digital Interface
Financial Data Analysis with Abstract Chart Grid Overlay
Green Line Graph Depicting Sustainability and Environmental Icons
Abstract Financial Data Processing and Analysis Interface
Premium
Blue stock market graph background with glowing lines and candlestick chart, financial data or business growth
Abstract Global Connectivity Diagram With World Map
Analyzing Stock Market Trends with Candlestick Chart and Data Visualization
Financial Growth Chart with Data Visualization Elements
Red Line Graph Displaying Complex Digital Trend Analysis
Premium
hand drawing graph on blackboard for groth your business cencept
Neon Green Line Graph Pulsing on Futuristic Blue Grid Dashboard for Data Analytics