
- Home >
- Stock Photos >
- Fluctuating Graphs with Digital Numbers for Financial Data Analysis
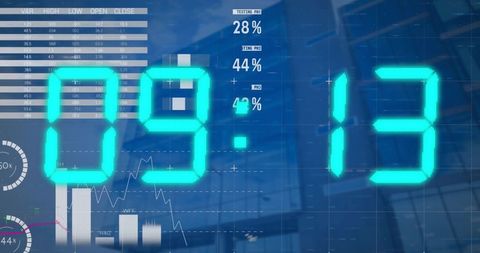
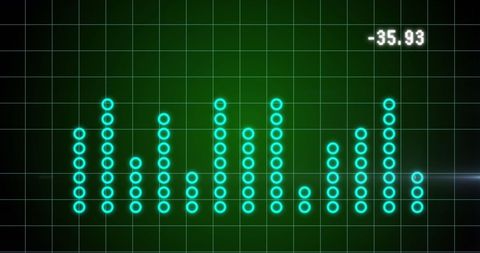
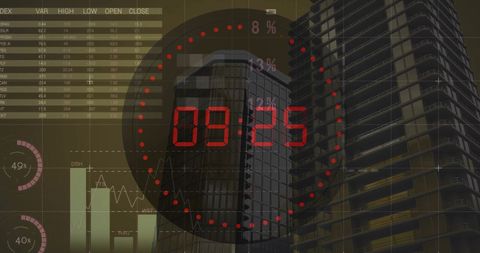
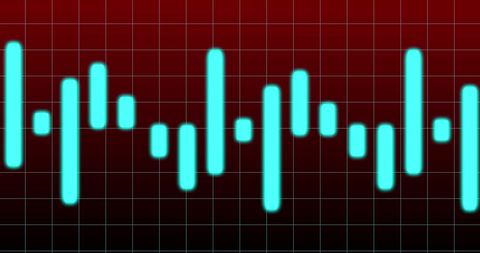
Fluctuating Graphs with Digital Numbers for Financial Data Analysis Image

Image features fluctuating graphs and large digital numbers, indicative of financial data analysis or stock market performance. Comprehensive visuals may be ideal for illustrating investment trends, economic analysis reports, financial blogs, or educational content focused on stock trading and economics. Can also be used for presentations and visuals concerning global financial markets.
Powered by  - Get 15% off with code: PIKWIZARD15


downloads
Tags:
More
Credit Photo
If you would like to credit the Photo, here are some ways you can do so
Text Link
photo Link
<span class="text-link">
<span>
<a target="_blank" href=https://pikwizard.com/photo/fluctuating-graphs-with-digital-numbers-for-financial-data-analysis/90a2667e098d56005f52a2d3acd61ee2/>PikWizard</a>
</span>
</span>
<span class="image-link">
<span
style="margin: 0 0 20px 0; display: inline-block; vertical-align: middle; width: 100%;"
>
<a
target="_blank"
href="https://pikwizard.com/photo/fluctuating-graphs-with-digital-numbers-for-financial-data-analysis/90a2667e098d56005f52a2d3acd61ee2/"
style="text-decoration: none; font-size: 10px; margin: 0;"
>
<img src="https://pikwizard.com/pw/medium/90a2667e098d56005f52a2d3acd61ee2.jpg" style="margin: 0; width: 100%;" alt="" />
<p style="font-size: 12px; margin: 0;">PikWizard</p>
</a>
</span>
</span>
Free (free of charge)
Free for personal and commercial use.
Author: Awesome Content
Similar Free Stock Images

Premium


Premium

Premium

Premium

Premium


Premium


Premium


Premium


Premium

Premium


Premium


Premium


Premium


Premium

Premium


Premium


Premium


Premium

Premium


Premium

Premium


Premium


Premium


Premium


Premium


Explore More Free Stock Images