
- Home >
- Stock Photos >
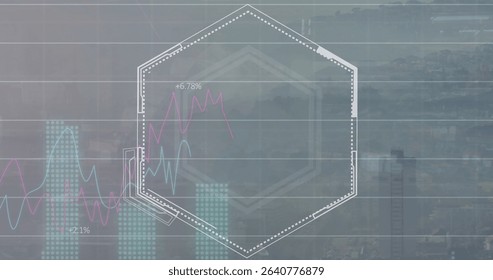
- Fluctuating Line Graphs on Blue Grid with City Skyline
Fluctuating Line Graphs on Blue Grid with City Skyline Image

Colorful line graphs signify financial trends on a digital blue grid background, superimposed over a city skyline silhouette. Useful for marketing materials, presentations on financial and economic trends, data analysis reports, or technology visualizations, this combination illustrates the intersection of analytics and urban environments.
Powered by  - Get 15% off with code: PIKWIZARD15


downloads
Tags:
More
Credit Photo
If you would like to credit the Photo, here are some ways you can do so
Text Link
photo Link
<span class="text-link">
<span>
<a target="_blank" href=https://pikwizard.com/photo/fluctuating-line-graphs-on-blue-grid-with-city-skyline/dff44ffb6bcef00a90a115e36dcb57b5/>PikWizard</a>
</span>
</span>
<span class="image-link">
<span
style="margin: 0 0 20px 0; display: inline-block; vertical-align: middle; width: 100%;"
>
<a
target="_blank"
href="https://pikwizard.com/photo/fluctuating-line-graphs-on-blue-grid-with-city-skyline/dff44ffb6bcef00a90a115e36dcb57b5/"
style="text-decoration: none; font-size: 10px; margin: 0;"
>
<img src="https://pikwizard.com/pw/medium/dff44ffb6bcef00a90a115e36dcb57b5.jpg" style="margin: 0; width: 100%;" alt="" />
<p style="font-size: 12px; margin: 0;">PikWizard</p>
</a>
</span>
</span>
Free (free of charge)
Free for personal and commercial use.
Author: Authentic Images
Similar Free Stock Images

Premium


Premium


Premium


Premium


Premium


Premium

Premium


Premium
Premium

Premium


Premium


Premium


Premium


Premium

Premium


Premium

Premium


Premium

Premium


Premium


Premium


Premium


Premium


Premium


Premium

Explore More Free Stock Images