
- Home >
- Stock Photos >
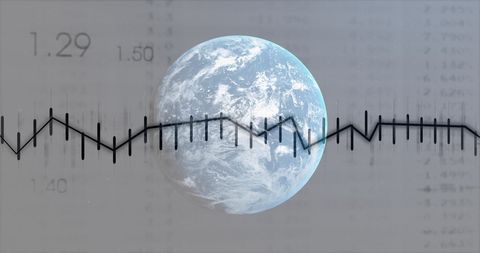
- Fluctuating Line Graphs Over Digital Grid Mesh
Fluctuating Line Graphs Over Digital Grid Mesh Image

Colorful line graphs in teal and orange move dynamically over a 3D grid featuring small dots, enhancing the technological and modern theme. Numerical labels alongside the curves indicate values, offering insights into data analysis and tracking trends. This design is suitable for presentations, infographics, apps focused on financial data, and technology-driven platforms, illustrating complex analytics in a visually engaging manner.
Powered by 


downloads
Tags:
More
Credit Photo
If you would like to credit the Photo, here are some ways you can do so
Text Link
photo Link
<span class="text-link">
<span>
<a target="_blank" href=https://pikwizard.com/photo/fluctuating-line-graphs-over-digital-grid-mesh/da07e27fdf35a723585e9350fb24b296/>PikWizard</a>
</span>
</span>
<span class="image-link">
<span
style="margin: 0 0 20px 0; display: inline-block; vertical-align: middle; width: 100%;"
>
<a
target="_blank"
href="https://pikwizard.com/photo/fluctuating-line-graphs-over-digital-grid-mesh/da07e27fdf35a723585e9350fb24b296/"
style="text-decoration: none; font-size: 10px; margin: 0;"
>
<img src="https://pikwizard.com/pw/medium/da07e27fdf35a723585e9350fb24b296.jpg" style="margin: 0; width: 100%;" alt="" />
<p style="font-size: 12px; margin: 0;">PikWizard</p>
</a>
</span>
</span>
Free (free of charge)
Free for personal and commercial use.
Author: People Creations
Similar Free Stock Images

Premium


Premium


Premium


Premium


Premium


Premium


Premium


Premium


Premium

Premium

Premium


Premium


Premium


Premium


Premium

Premium

Premium


Premium


Premium


Premium


Premium


Premium


Premium


Premium


Premium

Explore More Free Stock Images