- Home >
- Stock Photos >
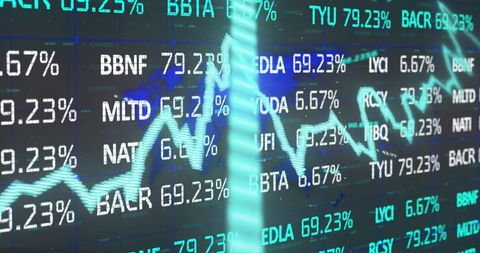
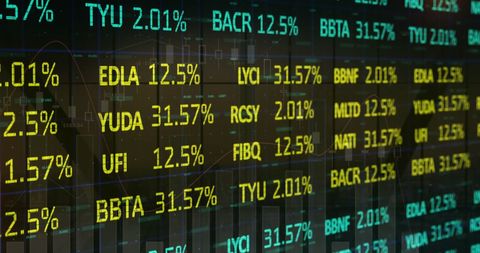
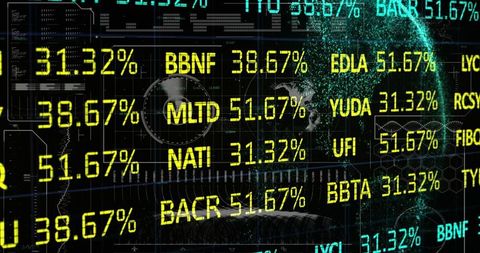
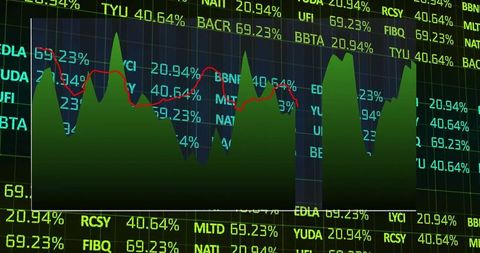
- Fluctuating Stock Market Data on Digital Screen
Fluctuating Stock Market Data on Digital Screen Image

This image of a digital screen displays fluctuating stock market data with various symbols and percentages. It visually represents the dynamic nature of financial markets and is suitable for use in contexts involving finance, economic analysis, investment strategies, and trading activities. Ideal for websites, blogs, or presentations on economic trends, stock market behavior, and investment advice.
Powered by 


2
downloads
downloads
Tags:
More
Credit Photo
If you would like to credit the Photo, here are some ways you can do so
Text Link
photo Link
<span class="text-link">
<span>
<a target="_blank" href=https://pikwizard.com/photo/fluctuating-stock-market-data-on-digital-screen/7af35755970037d5138d000d1d15dcc6/>PikWizard</a>
</span>
</span>
<span class="image-link">
<span
style="margin: 0 0 20px 0; display: inline-block; vertical-align: middle; width: 100%;"
>
<a
target="_blank"
href="https://pikwizard.com/photo/fluctuating-stock-market-data-on-digital-screen/7af35755970037d5138d000d1d15dcc6/"
style="text-decoration: none; font-size: 10px; margin: 0;"
>
<img src="https://pikwizard.com/pw/medium/7af35755970037d5138d000d1d15dcc6.jpg" style="margin: 0; width: 100%;" alt="" />
<p style="font-size: 12px; margin: 0;">PikWizard</p>
</a>
</span>
</span>
Free (free of charge)
Free for personal and commercial use.
Author: People Creations
Similar Free Stock Images

Premium


Premium


Premium


Premium


Premium


Premium


Premium


Premium


Premium


Premium


Premium


Premium


Premium


Premium


Premium


Premium


Premium


Premium


Premium


Premium


Premium


Premium


Premium


Premium


Premium