
- Home >
- Stock Photos >
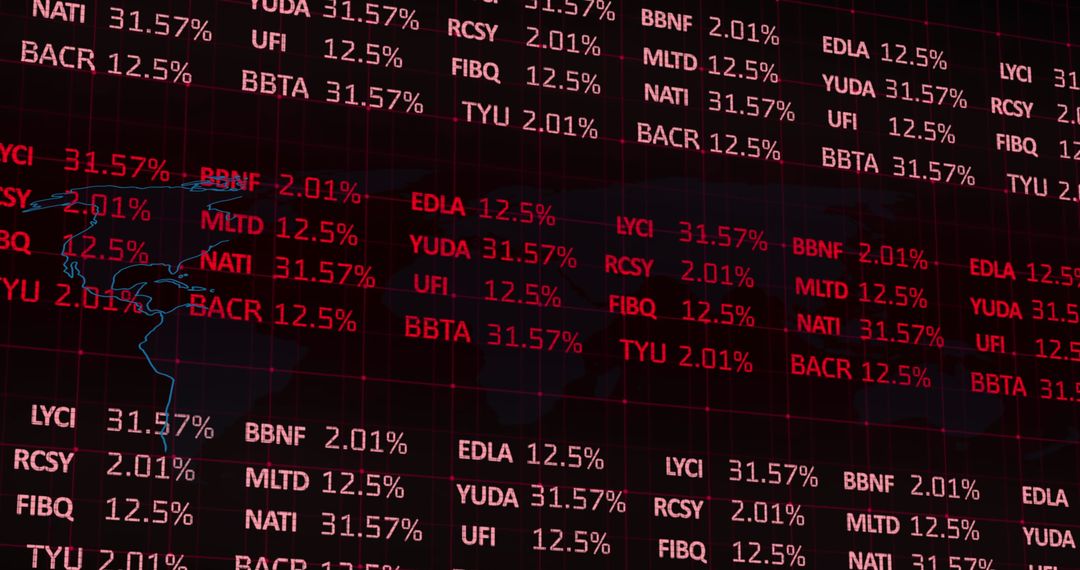
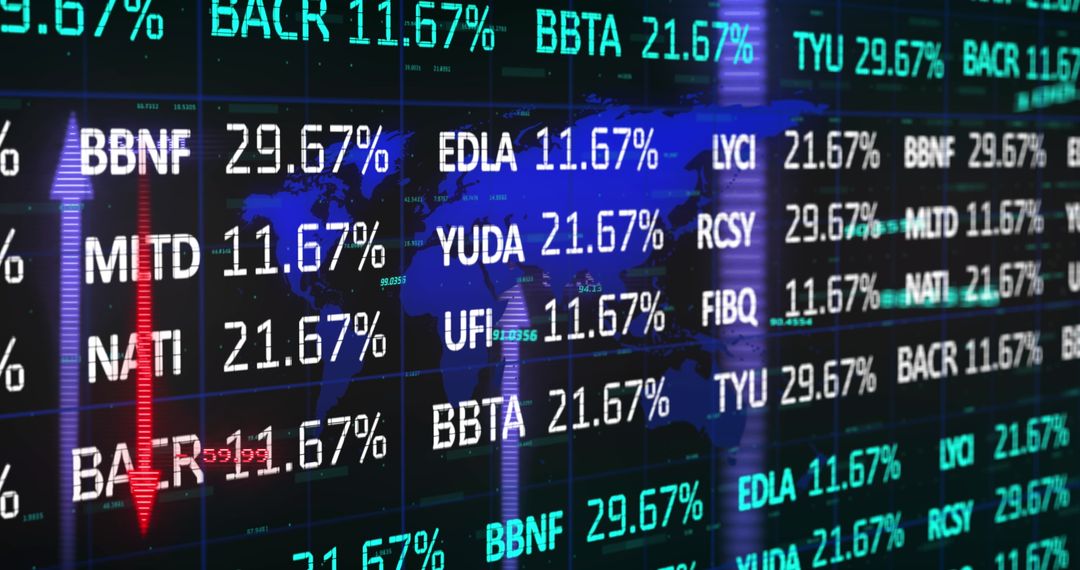
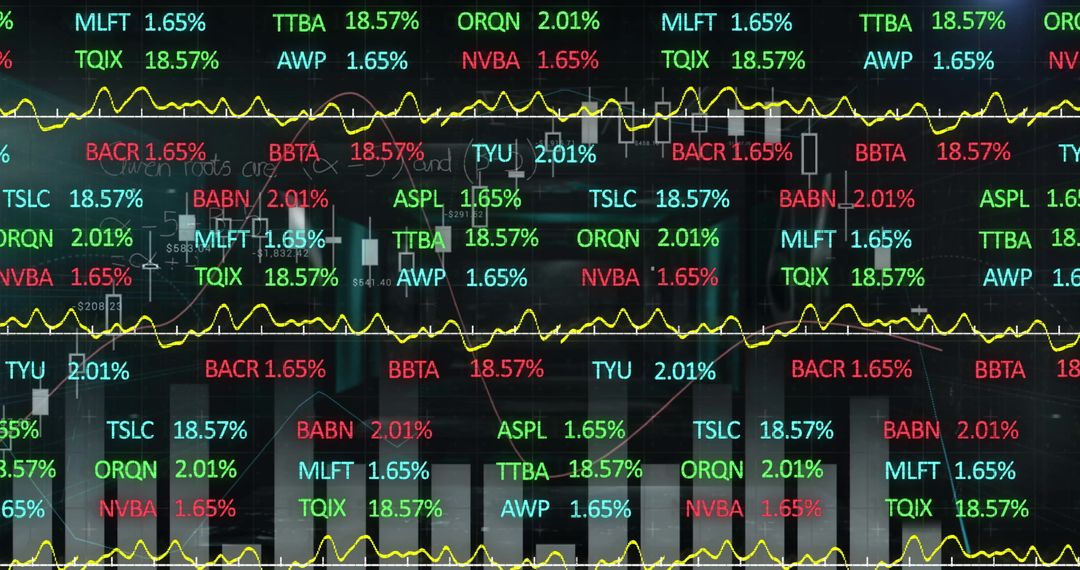
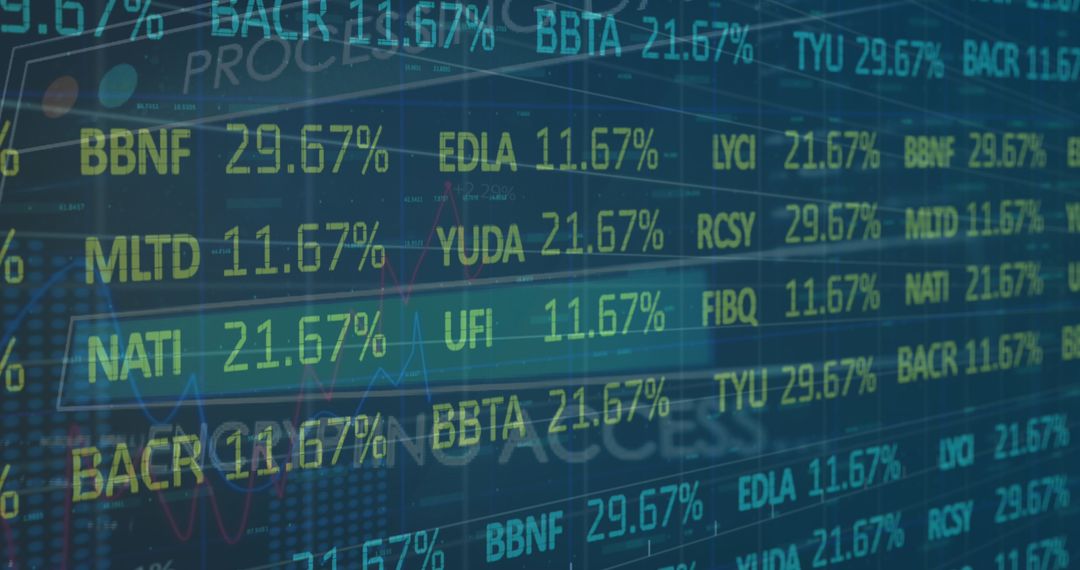
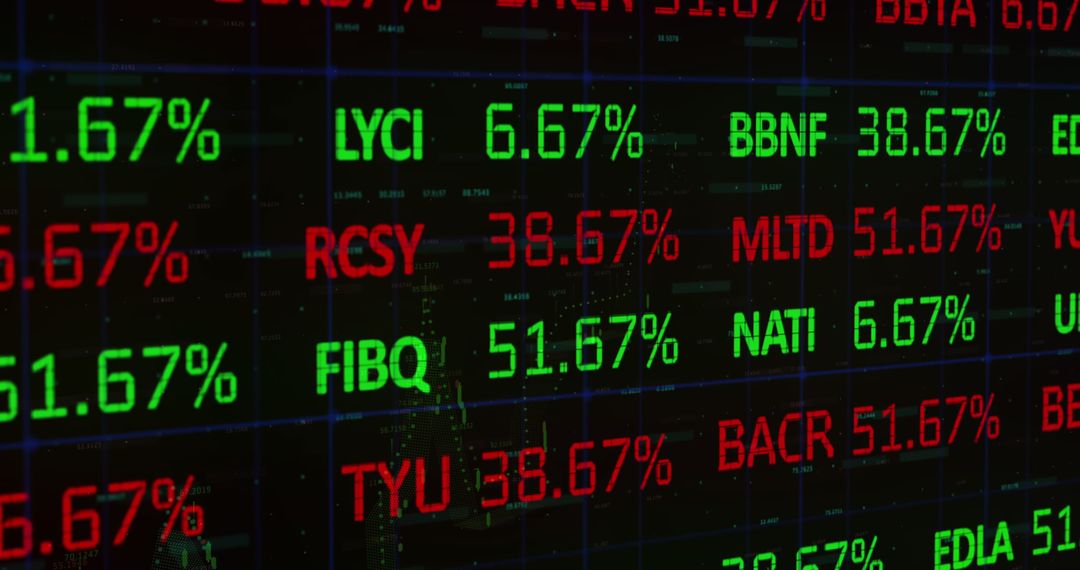
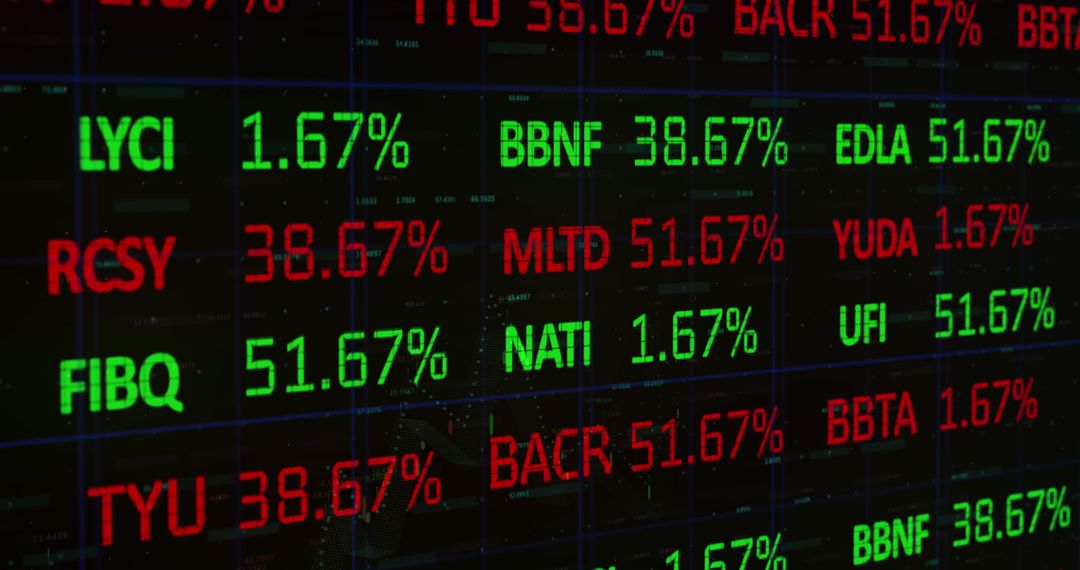
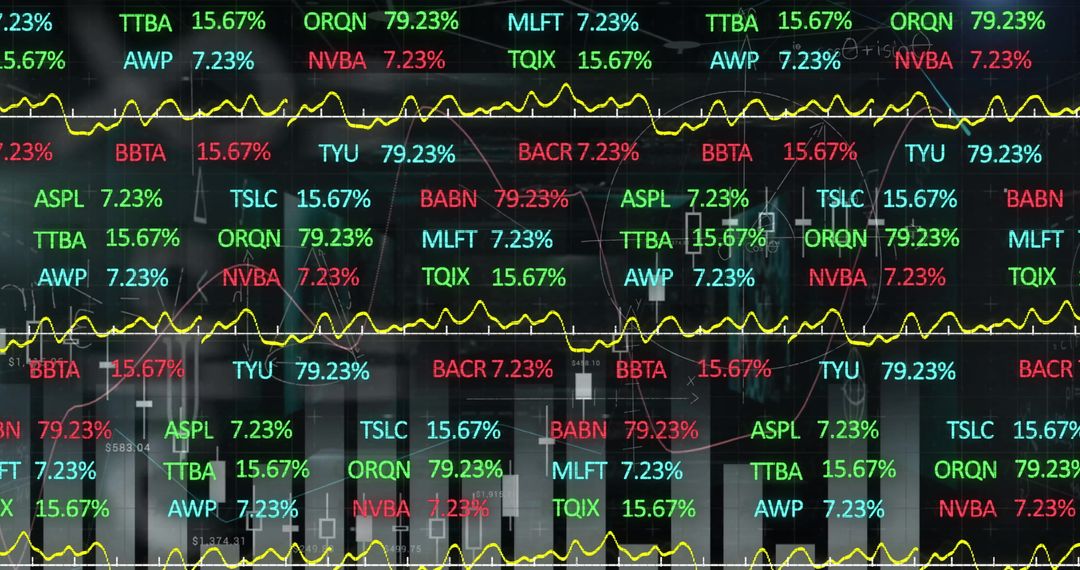
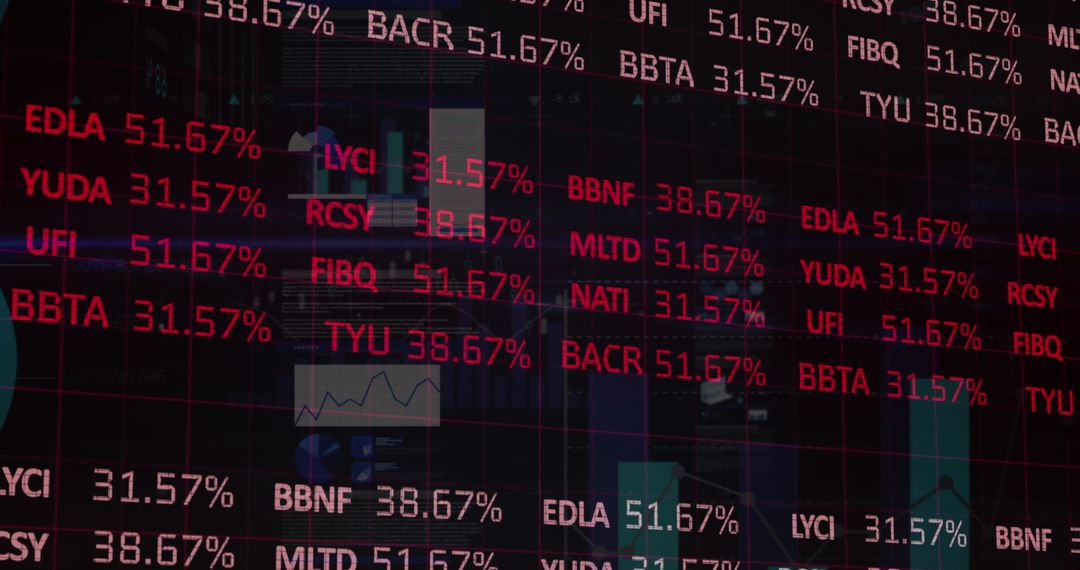
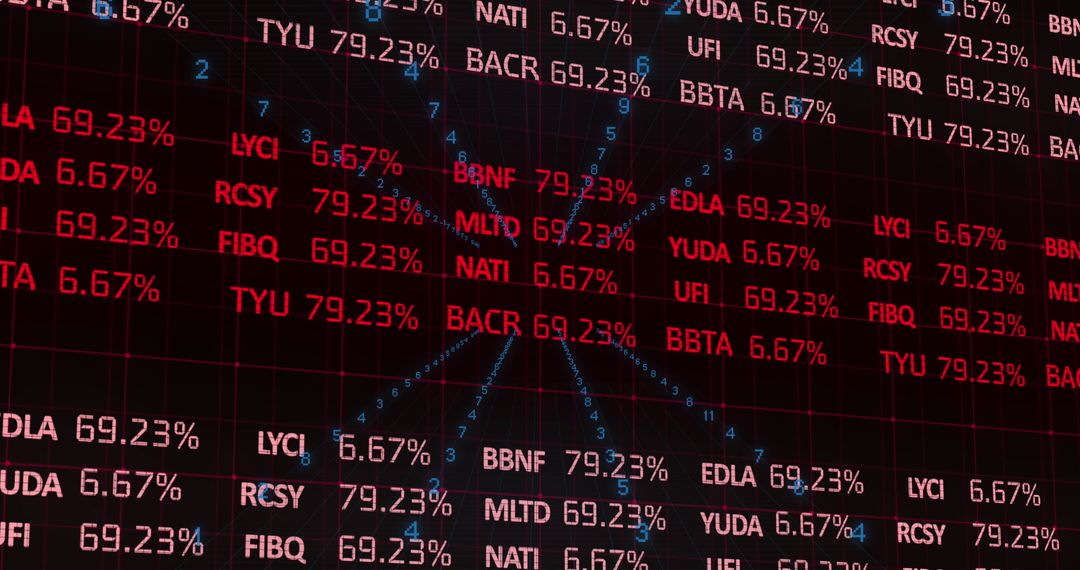
- Fluctuating Stock Market Graph with Red Numerical Data
Fluctuating Stock Market Graph with Red Numerical Data Image
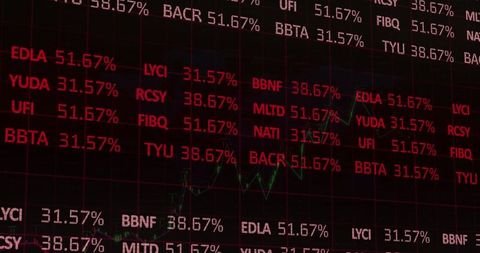
Display features red financial numbers on computer screen, symbolizing live stock and exchange rates. Ideal for illustrating concepts of economy fluctuations, financial market analysis, investment opportunities, stock forecasting, and trading strategies in business presentations, articles, and financial reports.
Powered by 


2
downloads
downloads
Tags:
More
Credit Photo
If you would like to credit the Photo, here are some ways you can do so
Text Link
photo Link
<span class="text-link">
<span>
<a target="_blank" href=https://pikwizard.com/photo/fluctuating-stock-market-graph-with-red-numerical-data/43a01c75308adb161bf5e8f0af0f788e/>PikWizard</a>
</span>
</span>
<span class="image-link">
<span
style="margin: 0 0 20px 0; display: inline-block; vertical-align: middle; width: 100%;"
>
<a
target="_blank"
href="https://pikwizard.com/photo/fluctuating-stock-market-graph-with-red-numerical-data/43a01c75308adb161bf5e8f0af0f788e/"
style="text-decoration: none; font-size: 10px; margin: 0;"
>
<img src="https://pikwizard.com/pw/medium/43a01c75308adb161bf5e8f0af0f788e.jpg" style="margin: 0; width: 100%;" alt="" />
<p style="font-size: 12px; margin: 0;">PikWizard</p>
</a>
</span>
</span>
Free (free of charge)
Free for personal and commercial use.
Author: Creative Art
Similar Free Stock Images

Premium


Premium


Premium


Premium


Premium


Premium


Premium


Premium


Premium


Premium


Premium


Premium


Premium


Premium


Premium


Premium


Premium


Premium


Premium


Premium


Premium


Premium


Premium


Premium

