- Home >
- Stock Photos >
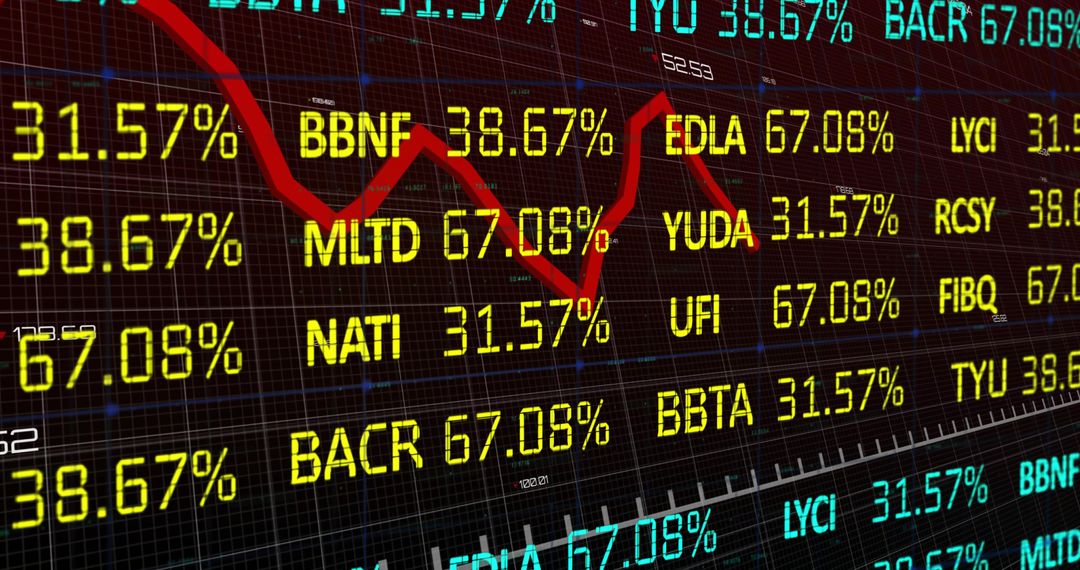
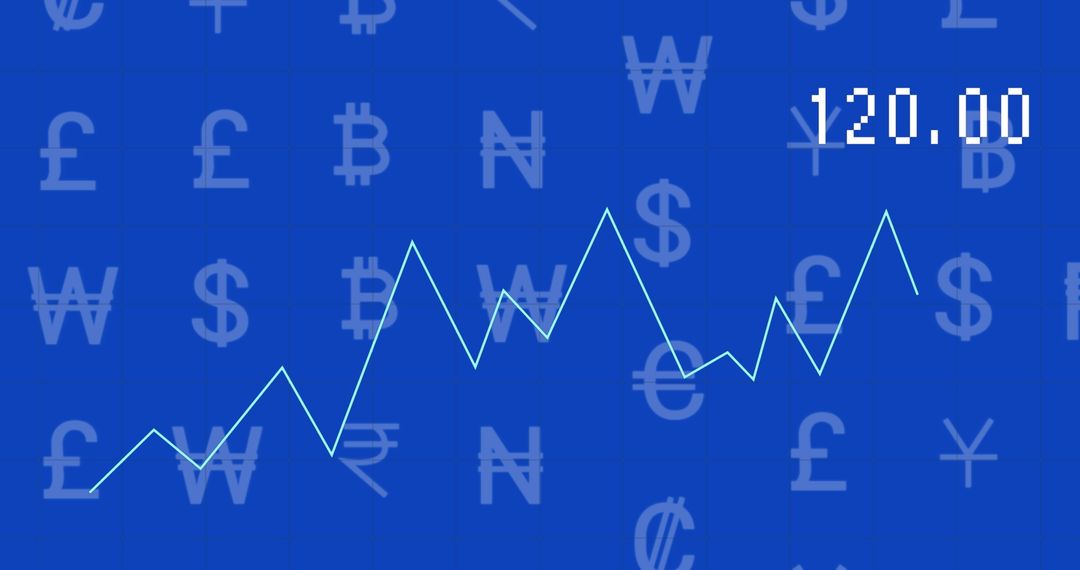
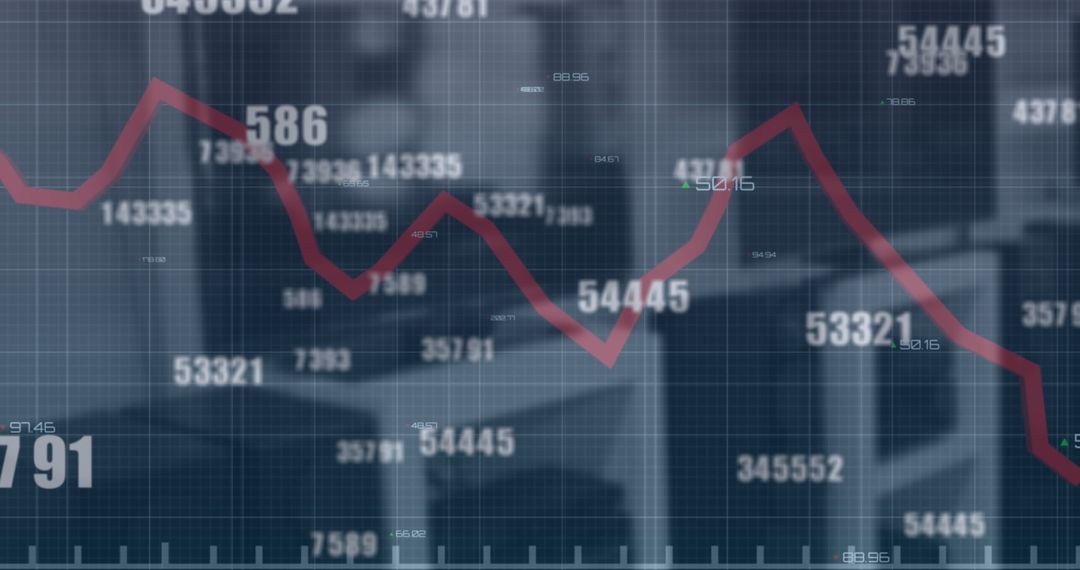
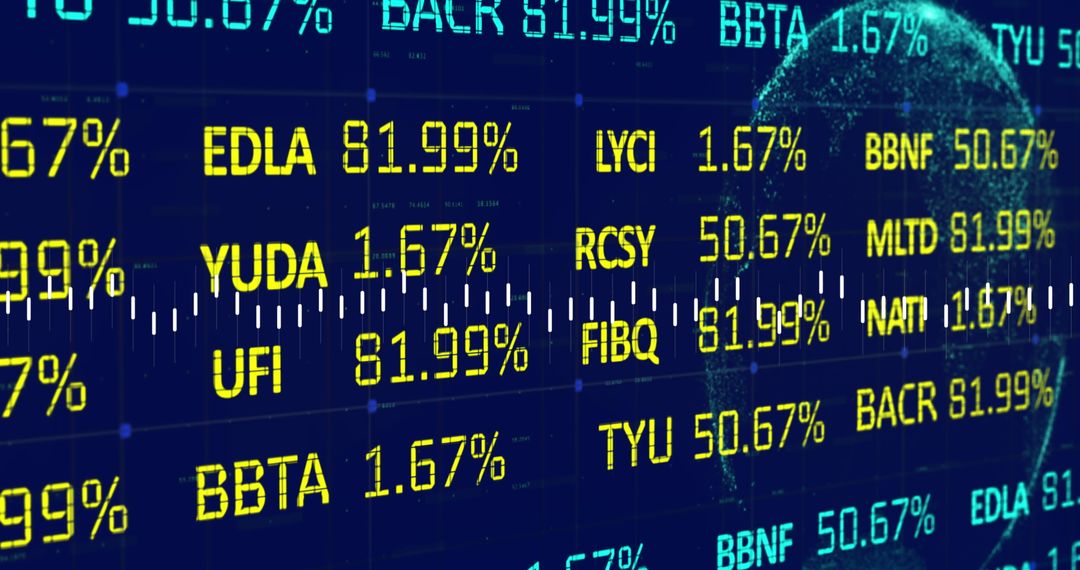
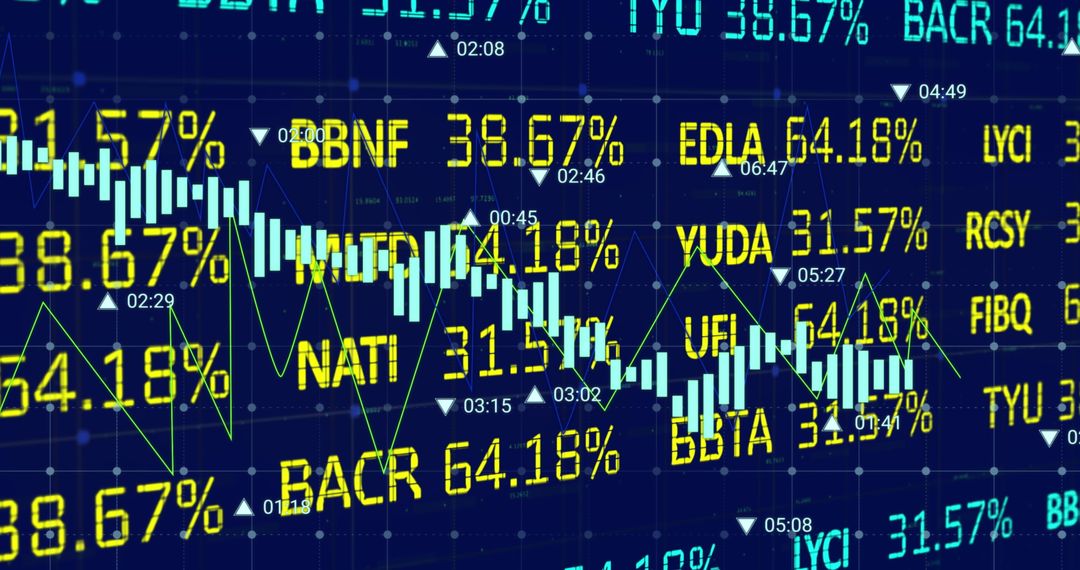
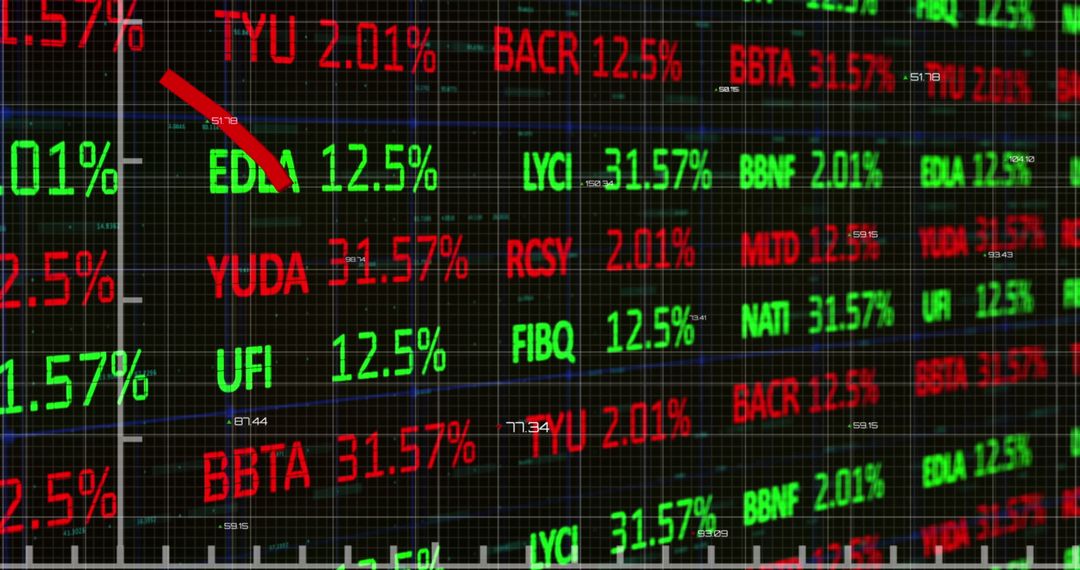
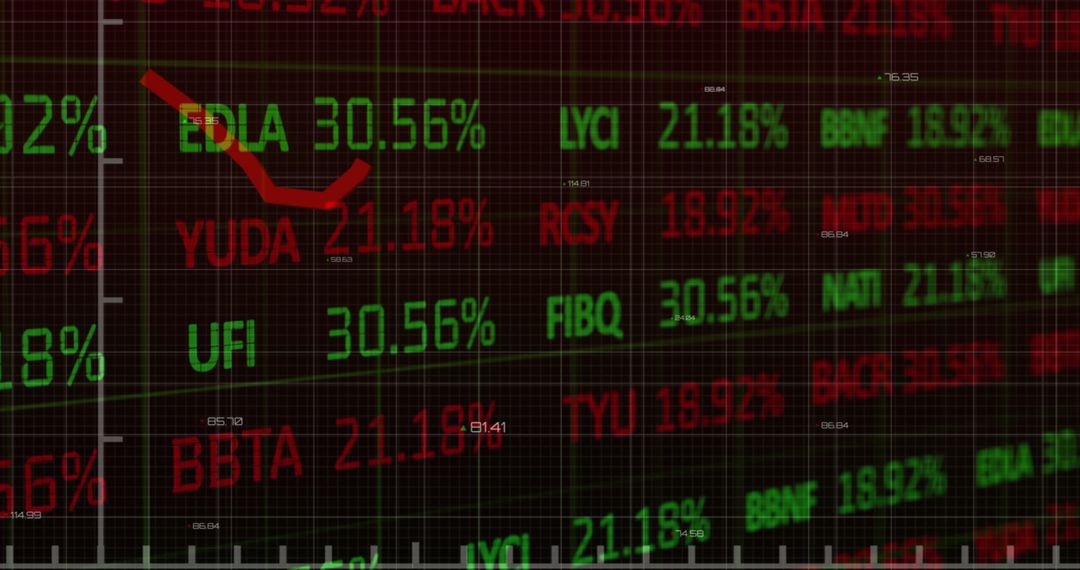
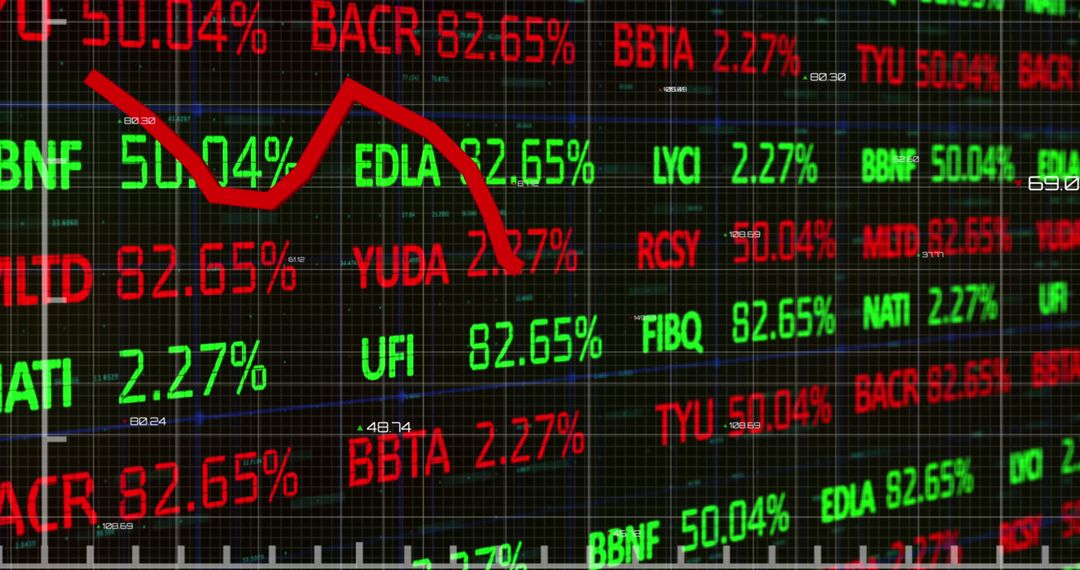
- Fluctuating Stock Market Graph with Symbols and Percentages
Fluctuating Stock Market Graph with Symbols and Percentages Image

An enticing display of a stock market graph showing various stock symbols with percentages, prominently featuring a fluctuating green line that indicates market movements. This visual is ideal for use in financial presentations, investment strategies planning, or educational materials exploring stock market dynamics. It emphasizes economic trends and trading analyses for professional reports or websites dedicated to finance and market intelligence.
Powered by  - Get 15% off with code: PIKWIZARD15


2
downloads
downloads
Tags:
More
Credit Photo
If you would like to credit the Photo, here are some ways you can do so
Text Link
photo Link
<span class="text-link">
<span>
<a target="_blank" href=https://pikwizard.com/photo/fluctuating-stock-market-graph-with-symbols-and-percentages/d1b956d2770e9079a6ccee449d0e472c/>PikWizard</a>
</span>
</span>
<span class="image-link">
<span
style="margin: 0 0 20px 0; display: inline-block; vertical-align: middle; width: 100%;"
>
<a
target="_blank"
href="https://pikwizard.com/photo/fluctuating-stock-market-graph-with-symbols-and-percentages/d1b956d2770e9079a6ccee449d0e472c/"
style="text-decoration: none; font-size: 10px; margin: 0;"
>
<img src="https://pikwizard.com/pw/medium/d1b956d2770e9079a6ccee449d0e472c.jpg" style="margin: 0; width: 100%;" alt="" />
<p style="font-size: 12px; margin: 0;">PikWizard</p>
</a>
</span>
</span>
Free (free of charge)
Free for personal and commercial use.
Author: Awesome Content
Similar Free Stock Images

Premium


Premium


Premium


Premium


Premium


Premium


Premium


Premium


Premium


Premium


Premium


Premium


Premium


Premium


Premium


Premium


Premium


Premium


Premium


Premium


Premium


Premium


Premium


Premium