- Home >
- Stock Photos >
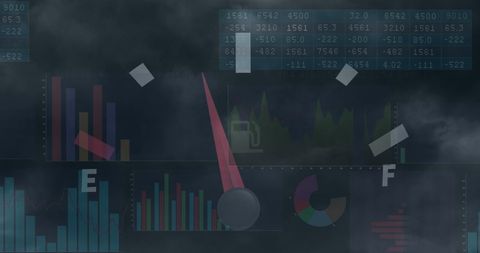
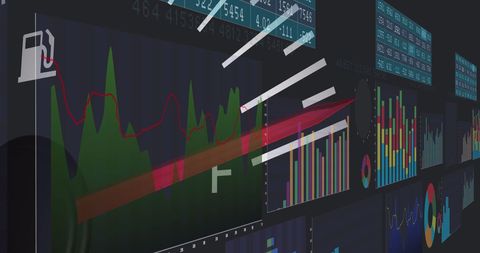
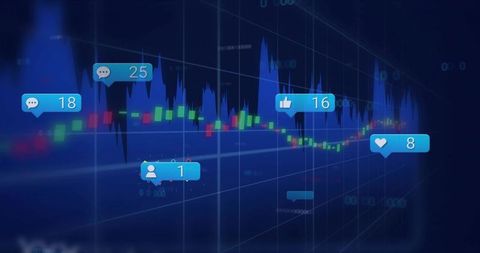
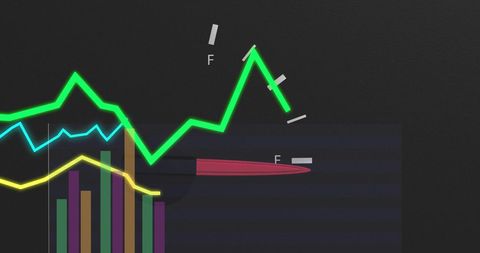
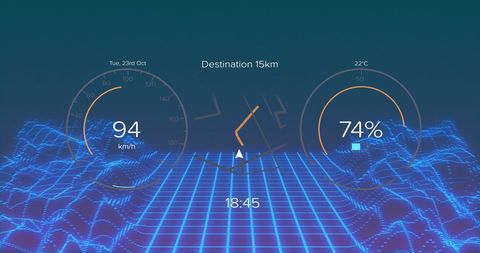
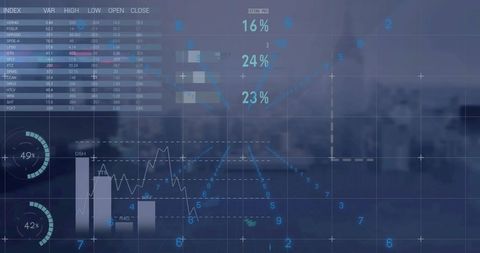
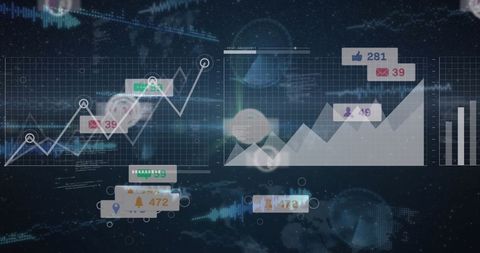
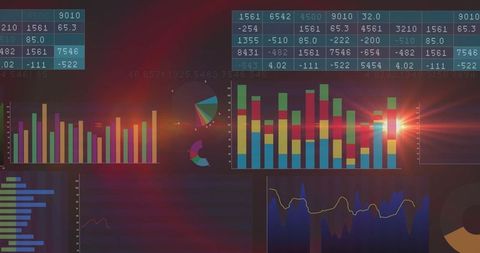
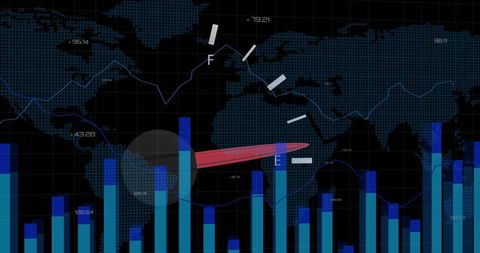
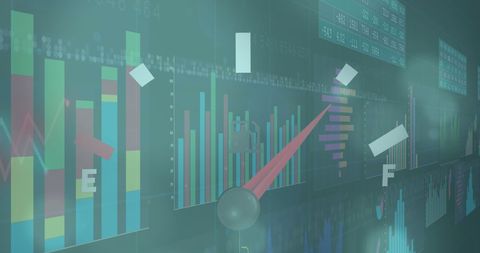
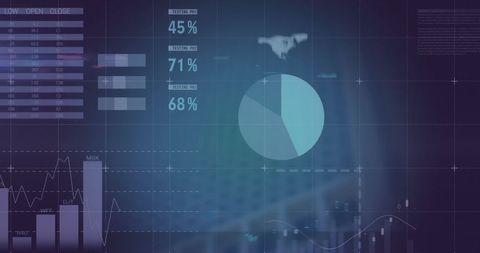
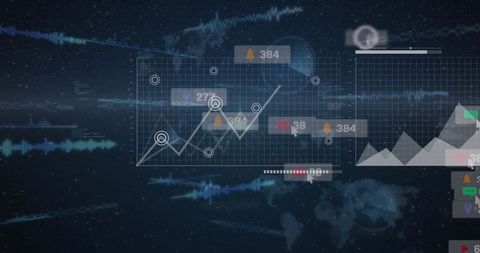
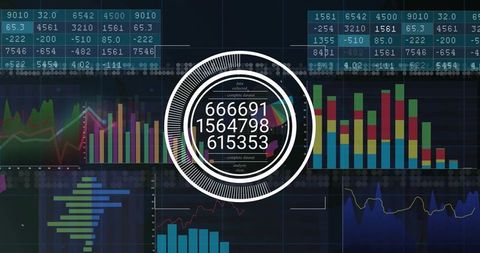
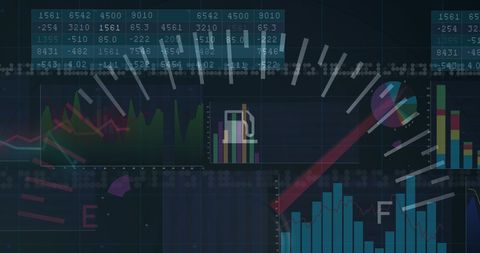
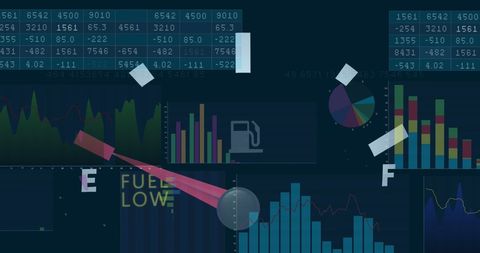
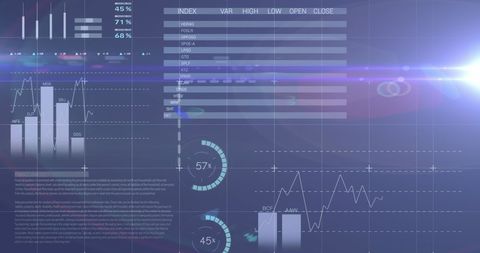
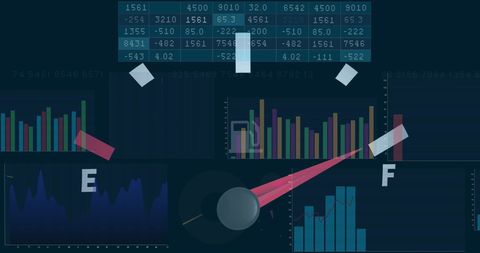
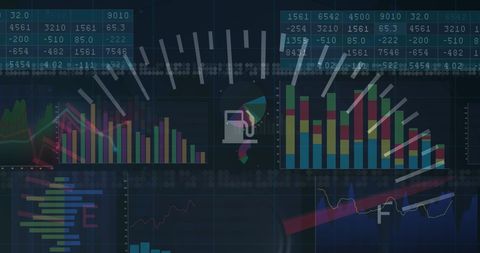
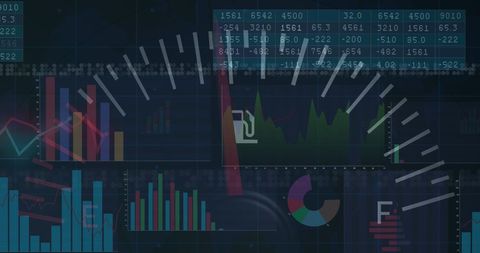
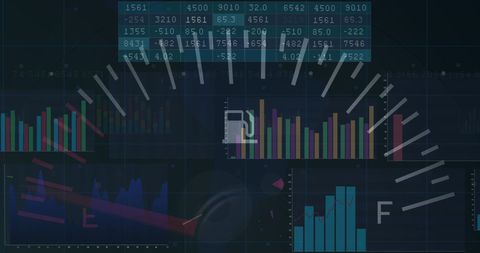
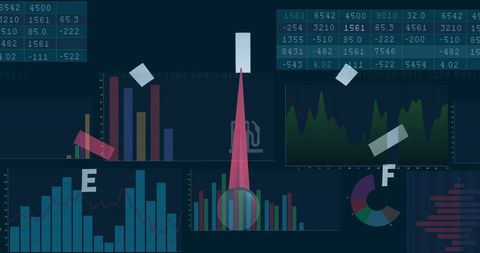
- Fuel Gauge and Statistical Data Visualizations
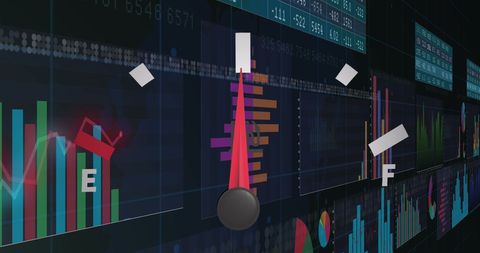
Fuel Gauge and Statistical Data Visualizations Image

Image features blend of fuel gauge with statistical charts and graphs, reflecting connection between automotive industry and data analytics. Ideal for articles or presentations on data processing in car manufacturing, analyzing fuel consumption statistics, or the role of data in modern business decision-making within automotive sectors.

downloads
Tags:
More
Credit Photo
If you would like to credit the Photo, here are some ways you can do so
Text Link
photo Link
<span class="text-link">
<span>
<a target="_blank" href=https://pikwizard.com/photo/fuel-gauge-and-statistical-data-visualizations/4c63901088a9c31702ee5c8cc1c58af5/>PikWizard</a>
</span>
</span>
<span class="image-link">
<span
style="margin: 0 0 20px 0; display: inline-block; vertical-align: middle; width: 100%;"
>
<a
target="_blank"
href="https://pikwizard.com/photo/fuel-gauge-and-statistical-data-visualizations/4c63901088a9c31702ee5c8cc1c58af5/"
style="text-decoration: none; font-size: 10px; margin: 0;"
>
<img src="https://pikwizard.com/pw/medium/4c63901088a9c31702ee5c8cc1c58af5.jpg" style="margin: 0; width: 100%;" alt="" />
<p style="font-size: 12px; margin: 0;">PikWizard</p>
</a>
</span>
</span>
Free (free of charge)
Free for personal and commercial use.
Author: People Creations