- Home >
- Stock Photos >
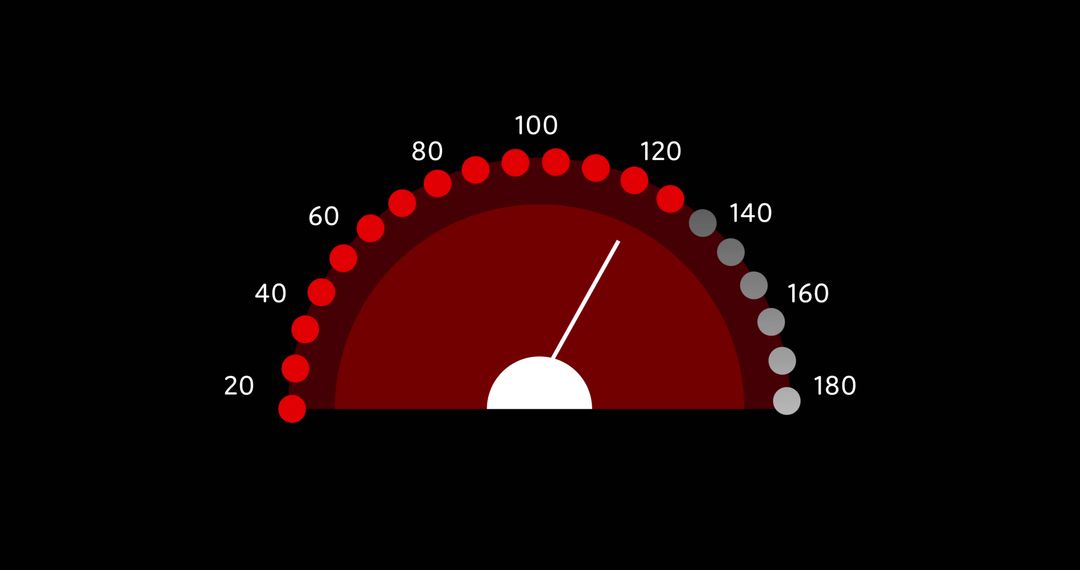
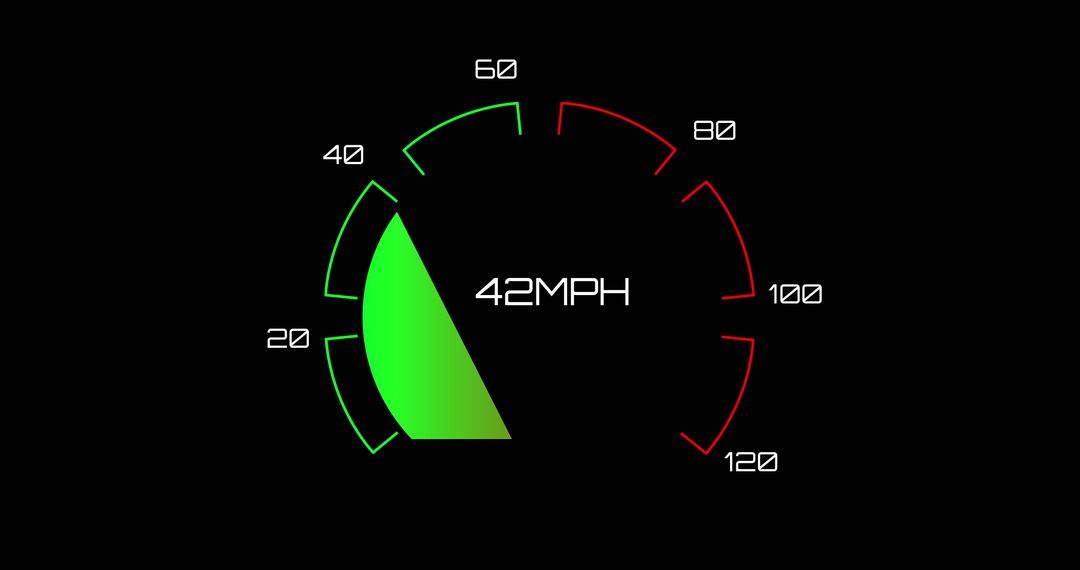
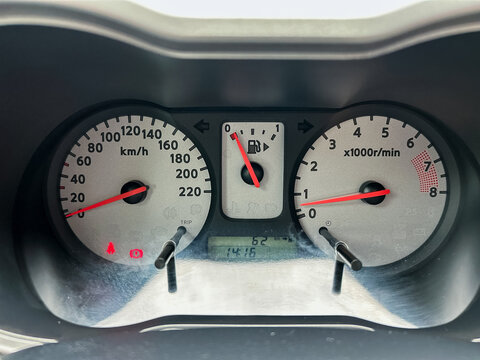
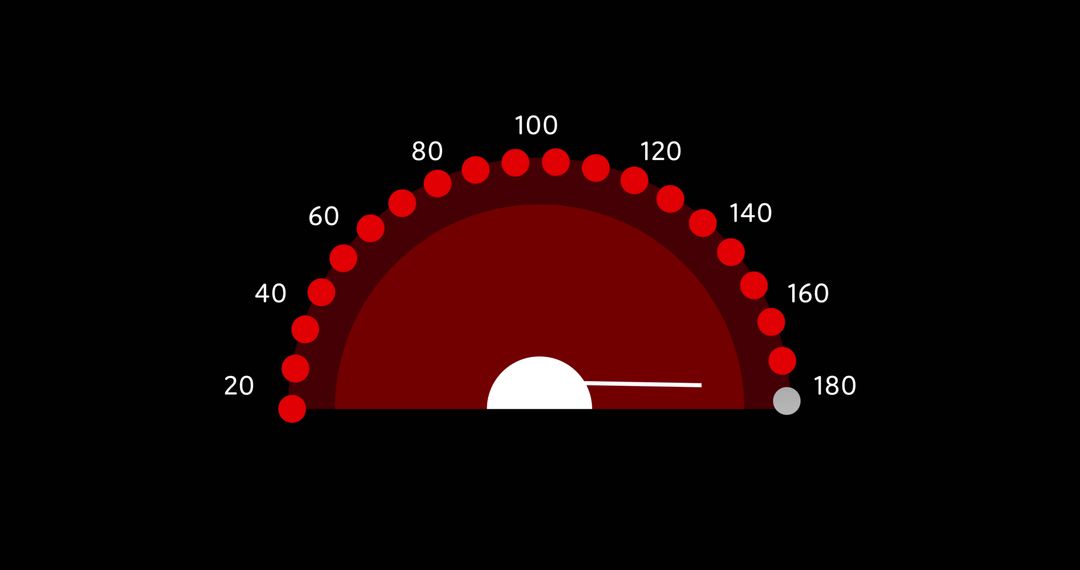
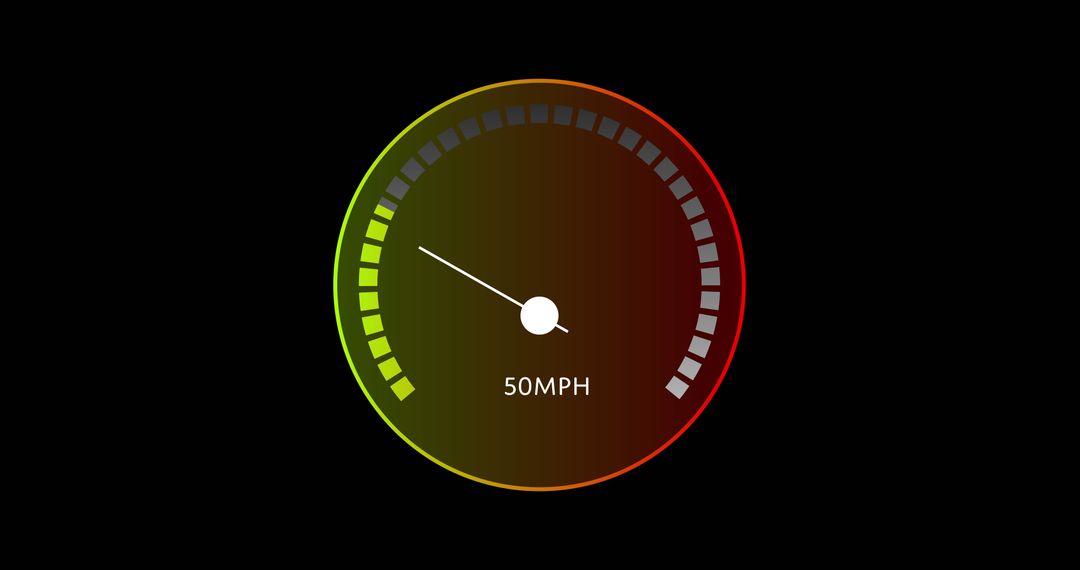
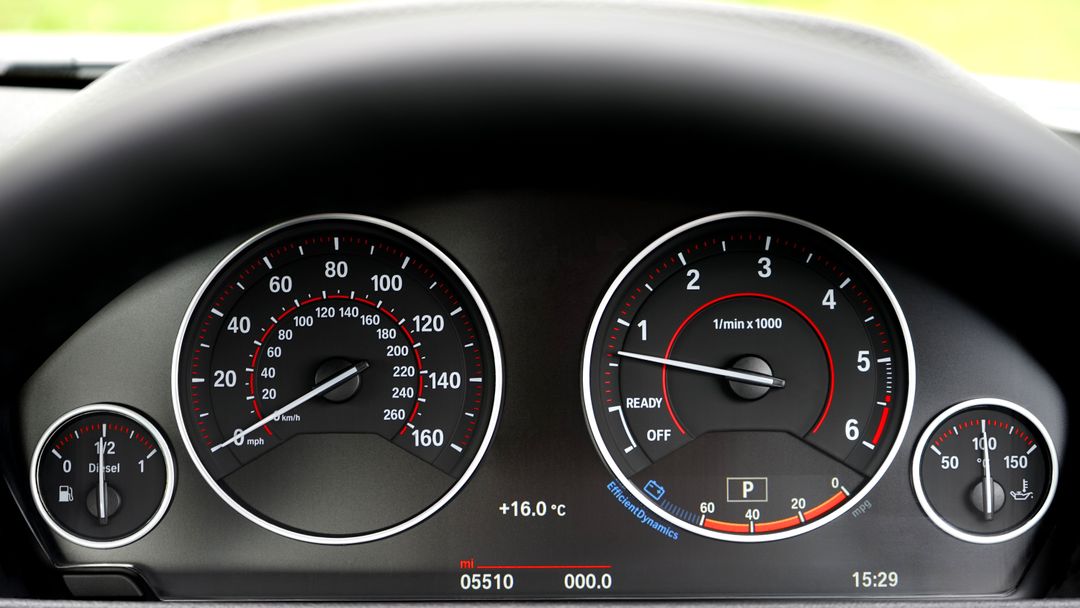
- Fuel Gauge Dashboard Overlay with Data Analytics and Graphs
Fuel Gauge Dashboard Overlay with Data Analytics and Graphs Image
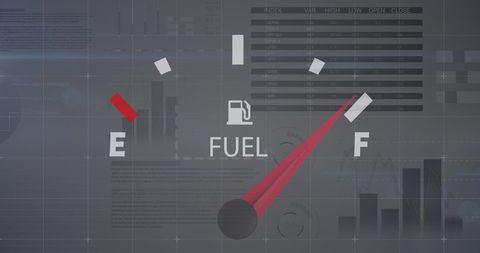
Dynamic illustration of a fuel gauge overlayed with various data analytics and graphs, emphasizing concepts of data processing and fuel management. Useful for presentations related to digital business solutions, automotive technology, and financial data analysis. Ideal for emphasizing integration of technology and traditional systems.
Powered by 


2
downloads
downloads
Tags:
More
Credit Photo
If you would like to credit the Photo, here are some ways you can do so
Text Link
photo Link
<span class="text-link">
<span>
<a target="_blank" href=https://pikwizard.com/photo/fuel-gauge-dashboard-overlay-with-data-analytics-and-graphs/5a44009973bdf6f23a79ed1653c14891/>PikWizard</a>
</span>
</span>
<span class="image-link">
<span
style="margin: 0 0 20px 0; display: inline-block; vertical-align: middle; width: 100%;"
>
<a
target="_blank"
href="https://pikwizard.com/photo/fuel-gauge-dashboard-overlay-with-data-analytics-and-graphs/5a44009973bdf6f23a79ed1653c14891/"
style="text-decoration: none; font-size: 10px; margin: 0;"
>
<img src="https://pikwizard.com/pw/medium/5a44009973bdf6f23a79ed1653c14891.jpg" style="margin: 0; width: 100%;" alt="" />
<p style="font-size: 12px; margin: 0;">PikWizard</p>
</a>
</span>
</span>
Free (free of charge)
Free for personal and commercial use.
Author: People Creations
Similar Free Stock Images

Premium


Premium


Premium


Premium


Premium


Premium


Premium