- Home >
- Stock Photos >
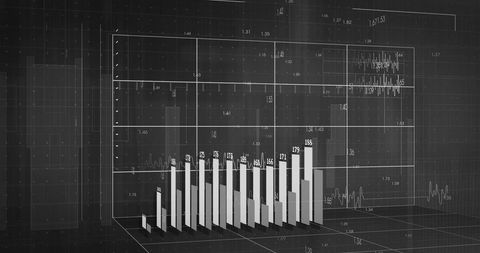
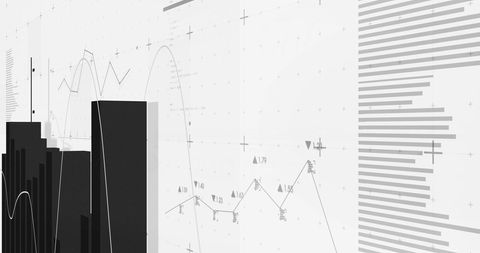
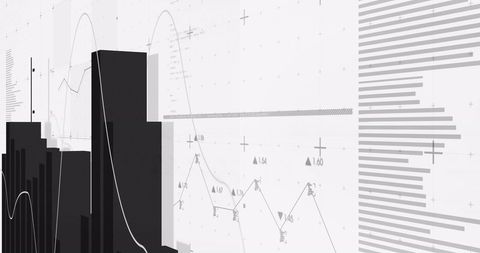
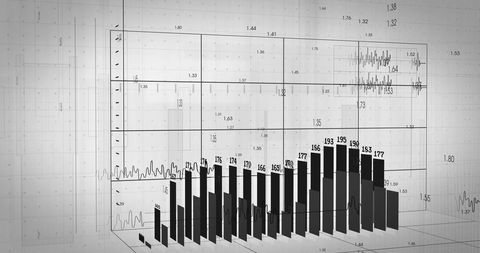
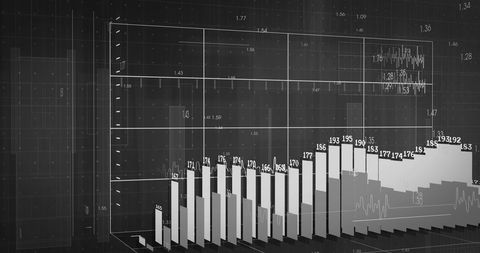
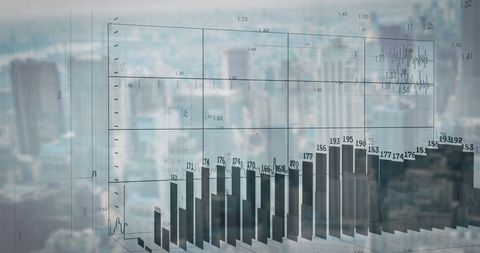
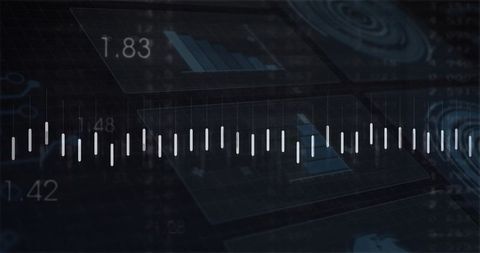
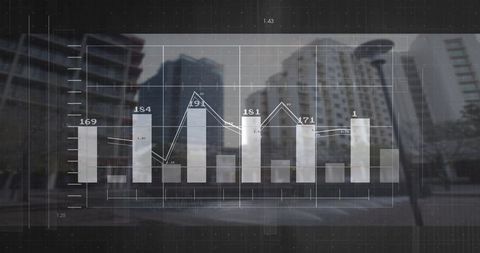
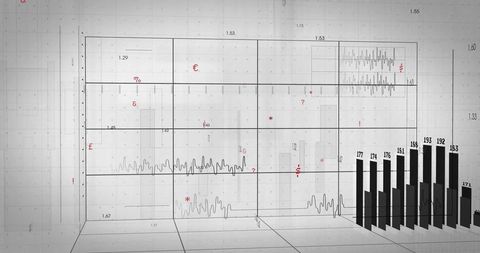
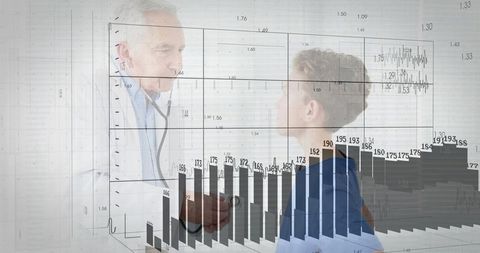
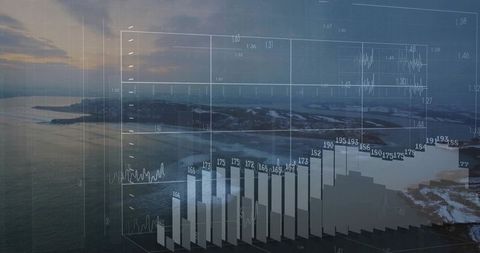
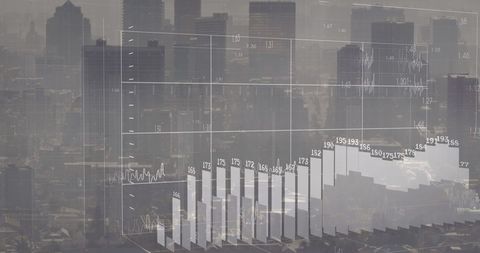
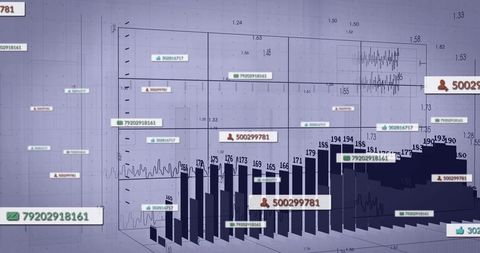
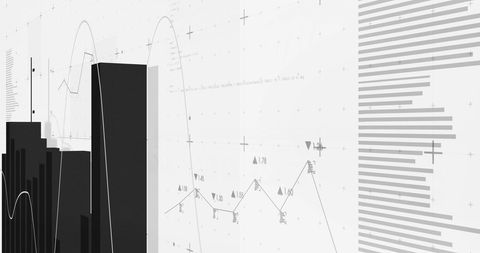
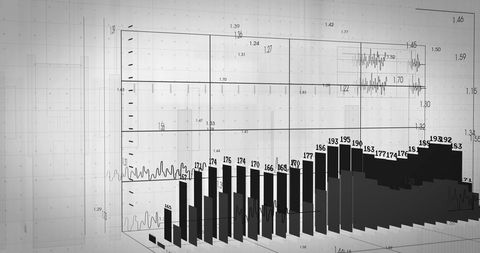
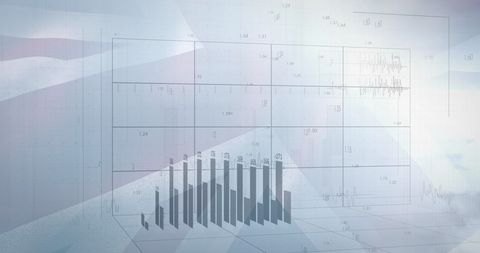
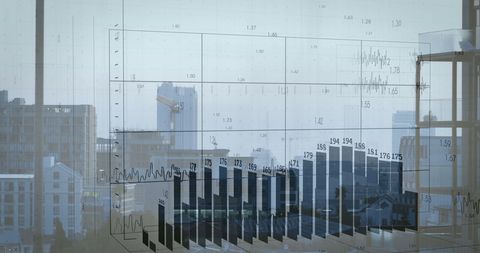
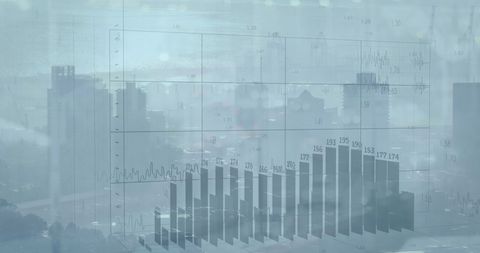
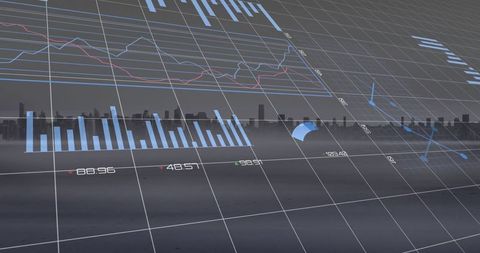
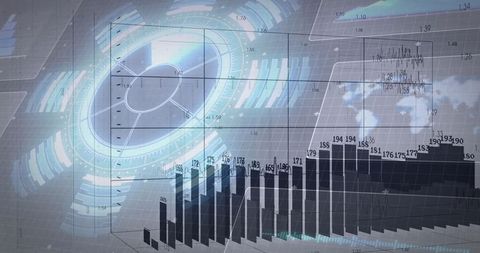
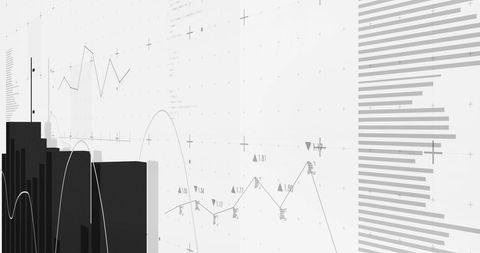
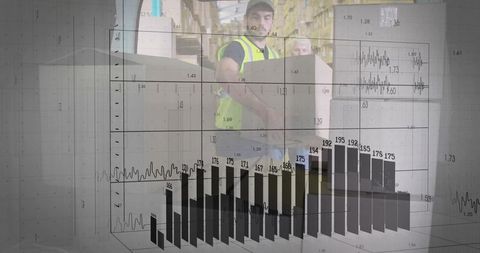
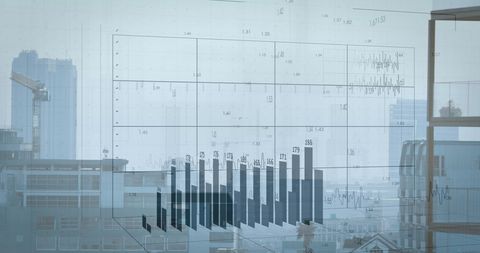
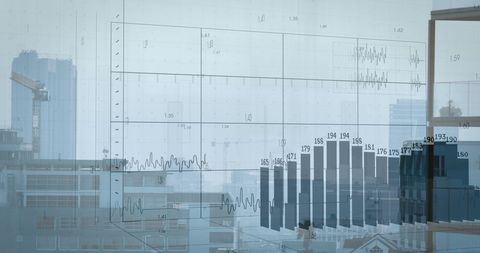
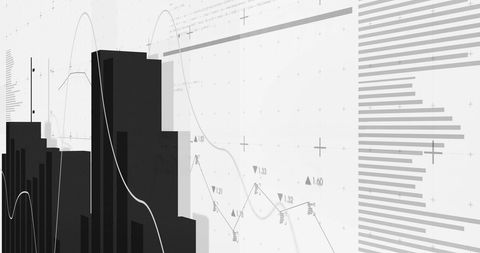
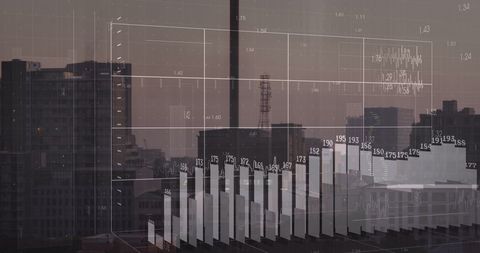
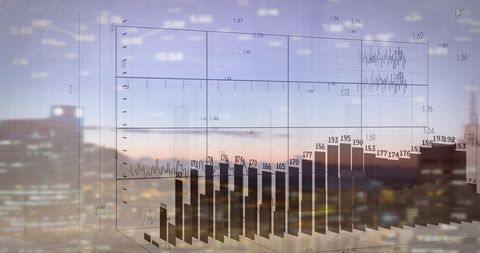
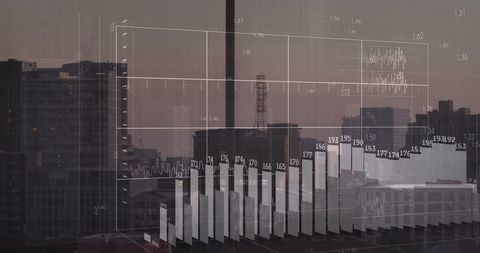
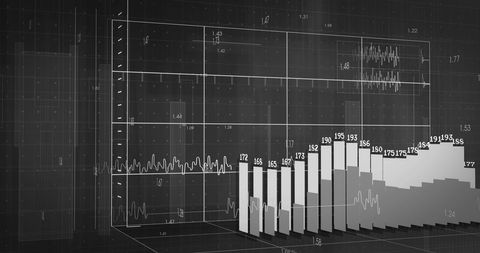
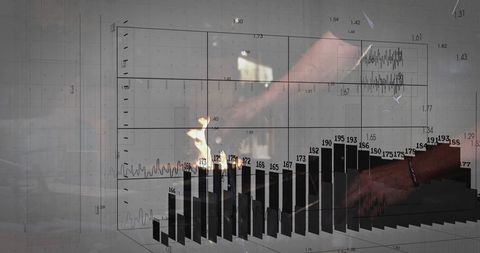
- Futuristic 3D Bar Chart with Floating Numeric Elements
Futuristic 3D Bar Chart with Floating Numeric Elements Image
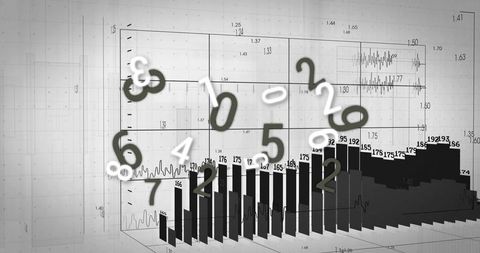
This dynamic scene portrays an advanced form of data visualization where a 3D bar chart is complemented by floating numeric elements amidst translucent grid planes. Ideal for use in tech presentations and educational materials that require a striking presentation of data and statistics. The experimental and abstract design attracts interest in innovative communication, analysis software demonstrations, and modern infographic creations.

downloads
Tags:
More
Credit Photo
If you would like to credit the Photo, here are some ways you can do so
Text Link
photo Link
<span class="text-link">
<span>
<a target="_blank" href=https://pikwizard.com/photo/futuristic-3d-bar-chart-with-floating-numeric-elements/e4cd5cea2dbe271c971f2e7838b2cdb4/>PikWizard</a>
</span>
</span>
<span class="image-link">
<span
style="margin: 0 0 20px 0; display: inline-block; vertical-align: middle; width: 100%;"
>
<a
target="_blank"
href="https://pikwizard.com/photo/futuristic-3d-bar-chart-with-floating-numeric-elements/e4cd5cea2dbe271c971f2e7838b2cdb4/"
style="text-decoration: none; font-size: 10px; margin: 0;"
>
<img src="https://pikwizard.com/pw/medium/e4cd5cea2dbe271c971f2e7838b2cdb4.jpg" style="margin: 0; width: 100%;" alt="" />
<p style="font-size: 12px; margin: 0;">PikWizard</p>
</a>
</span>
</span>
Free (free of charge)
Free for personal and commercial use.
Author: Awesome Content