- Home >
- Stock Photos >
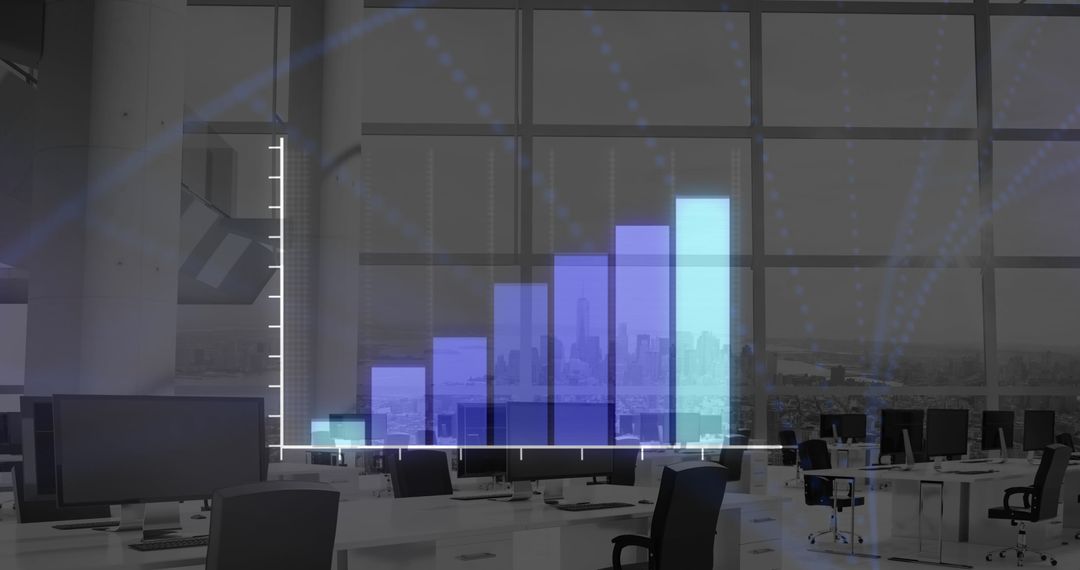
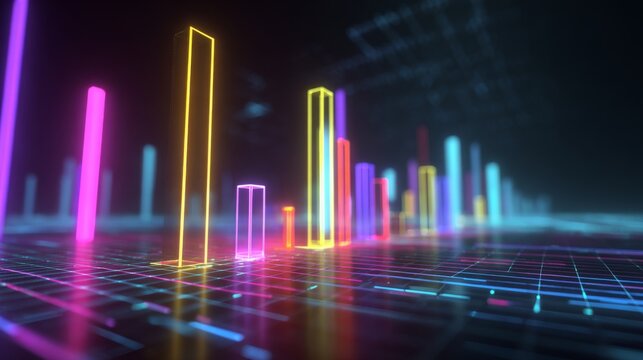
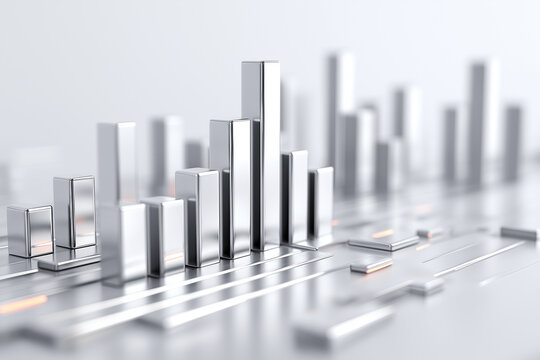
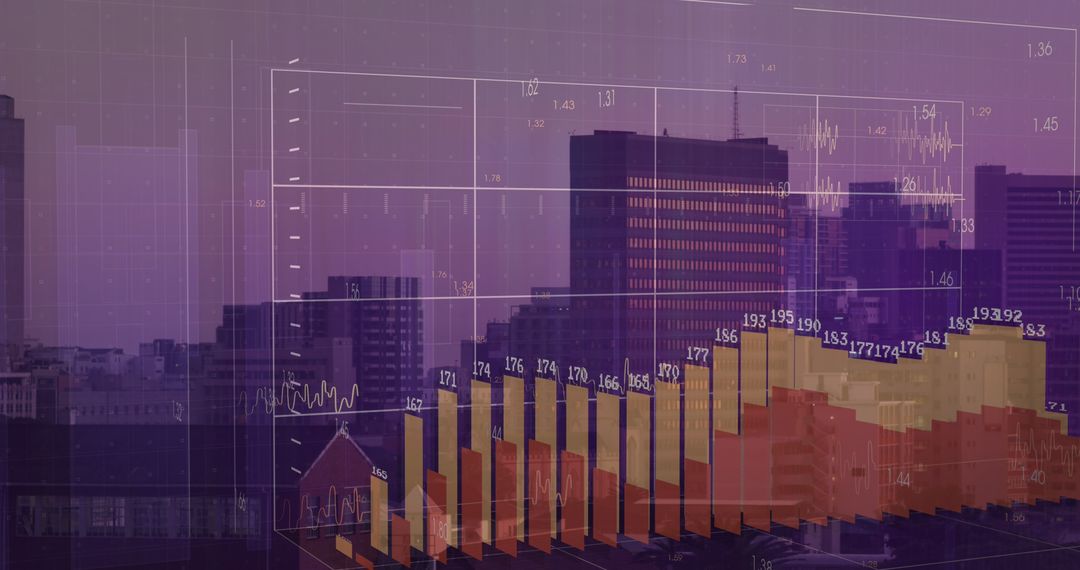
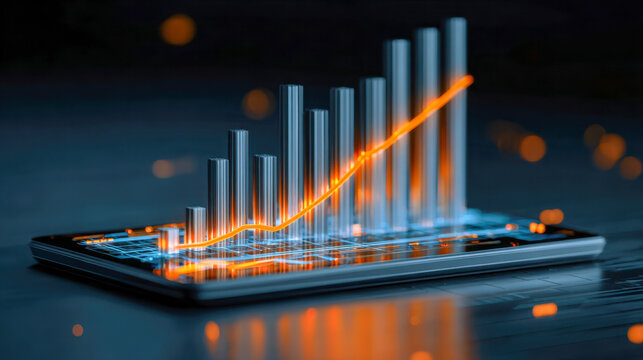
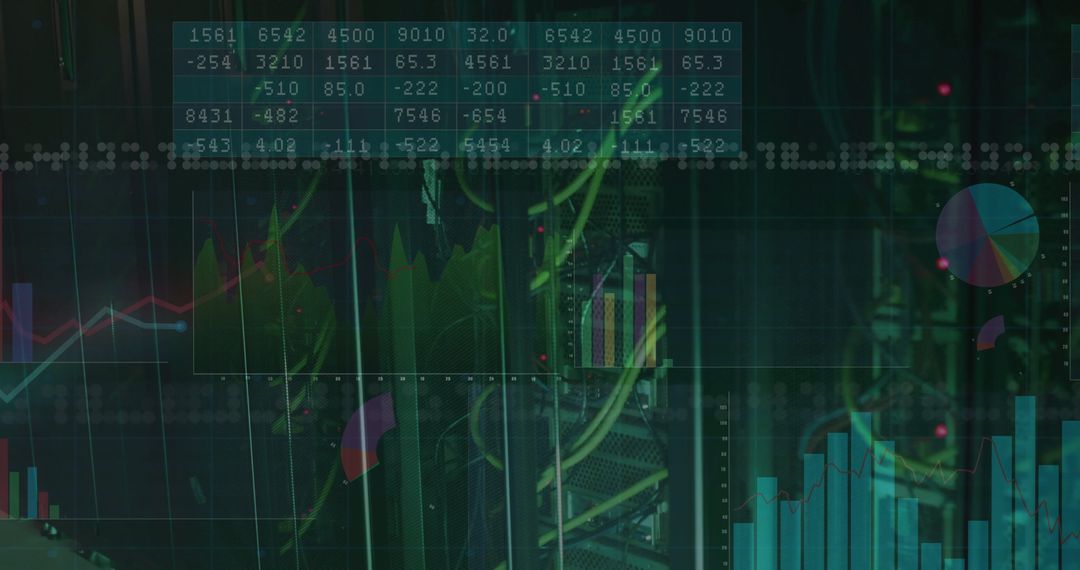
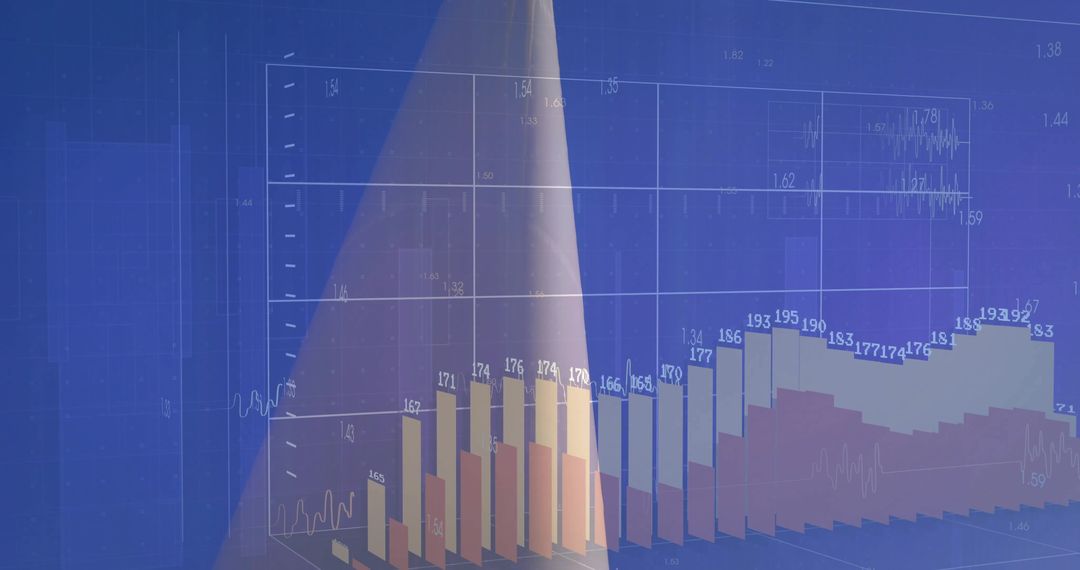
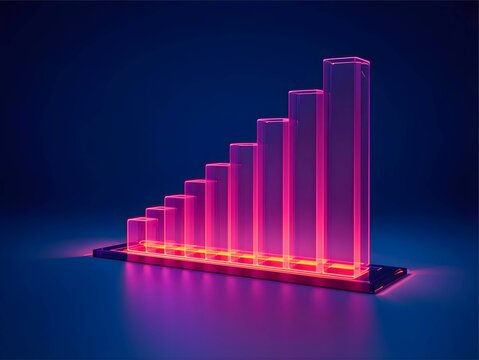
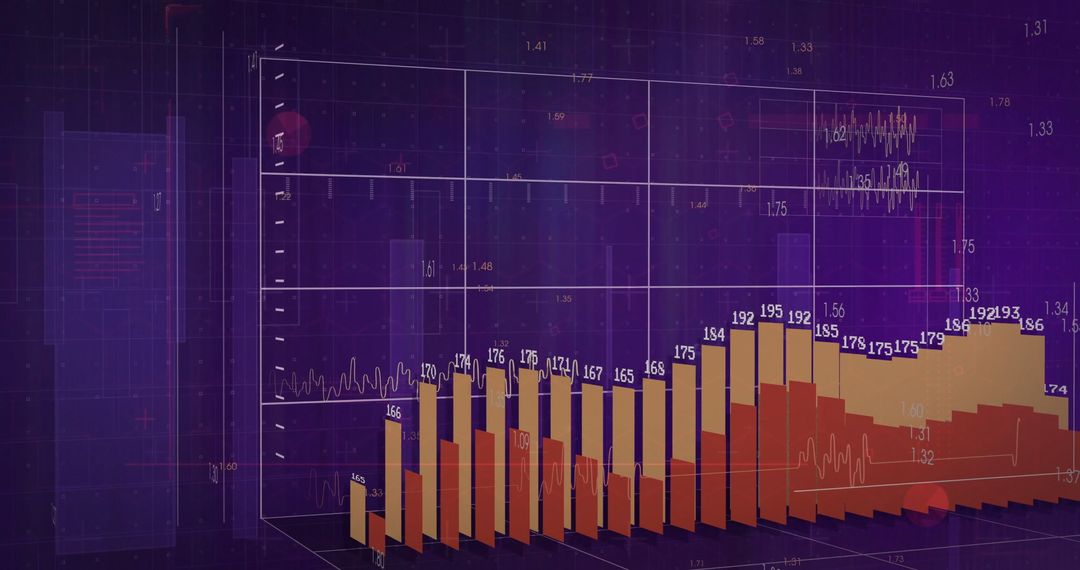
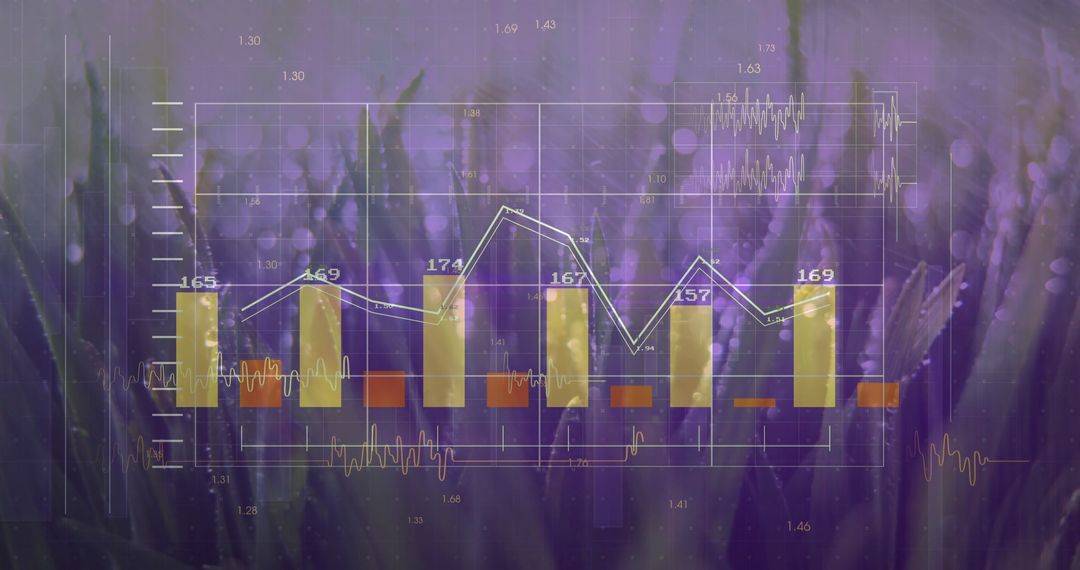
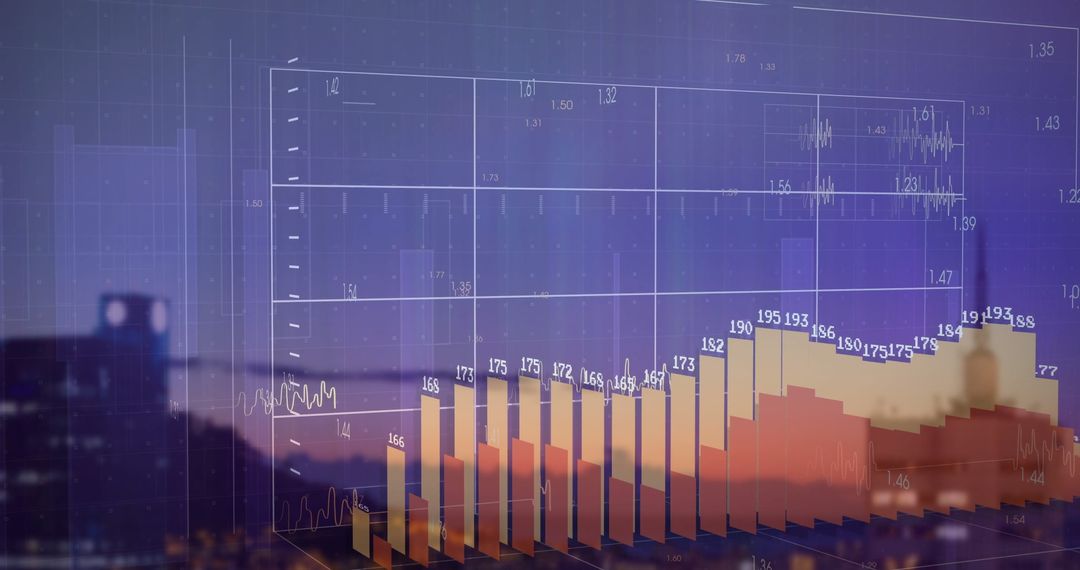
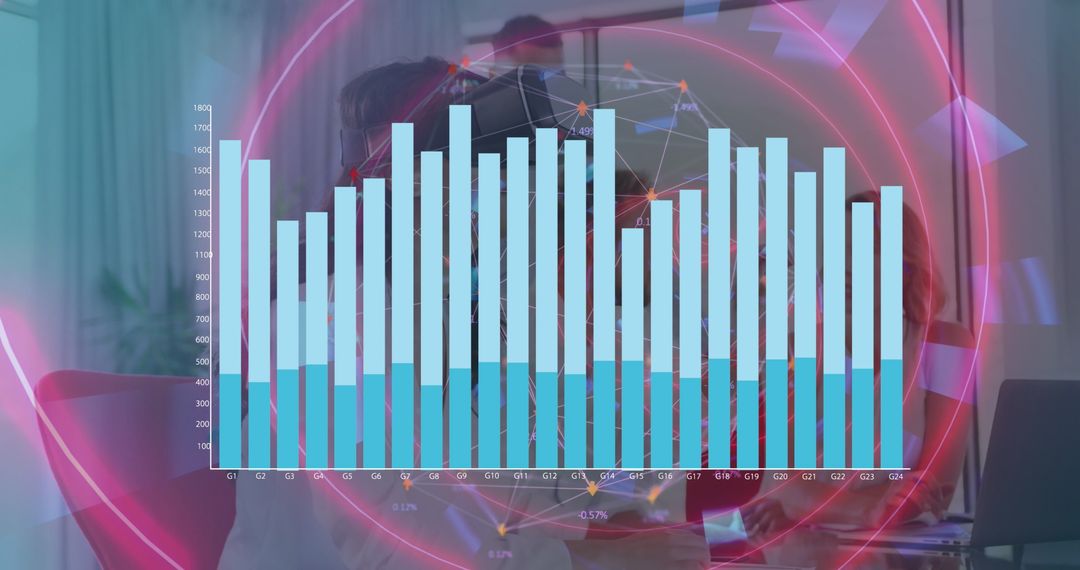
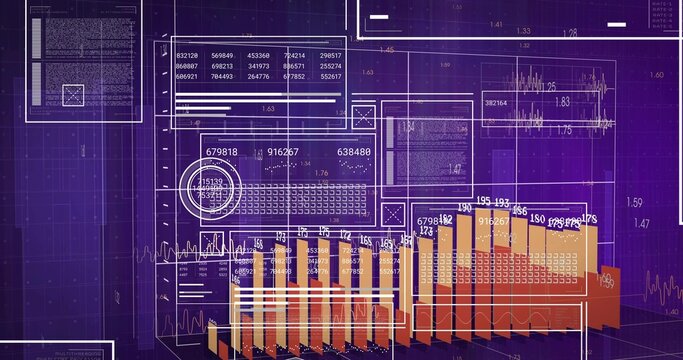
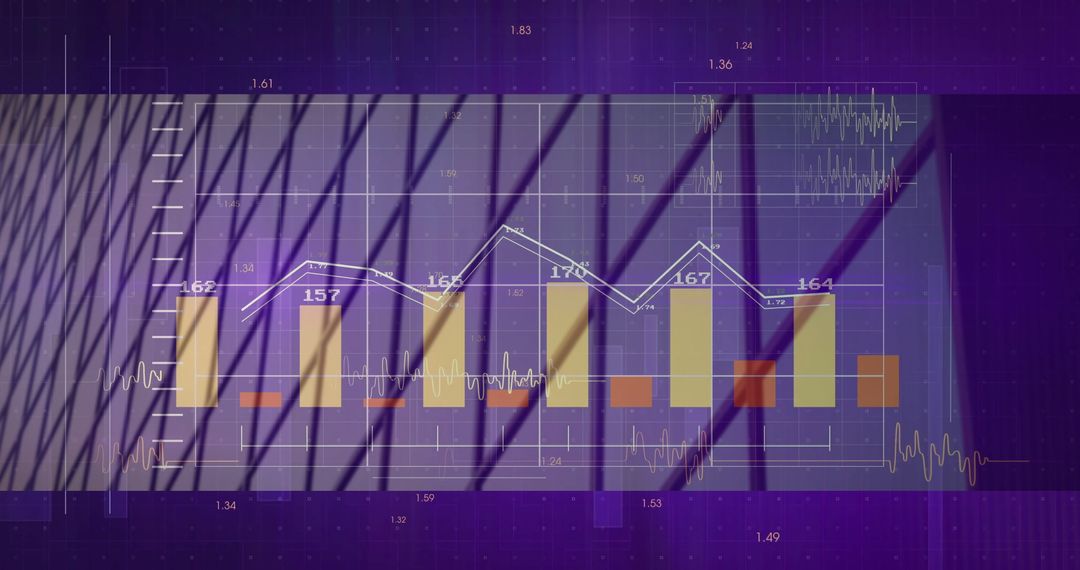
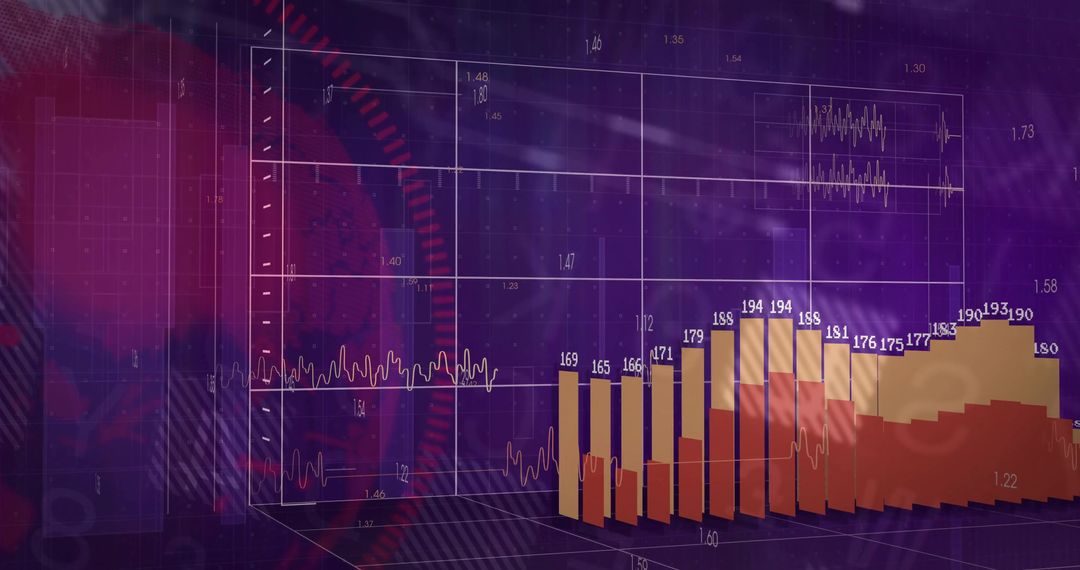
- Futuristic 3D Bar Chart with Gradient on Digital Dashboard
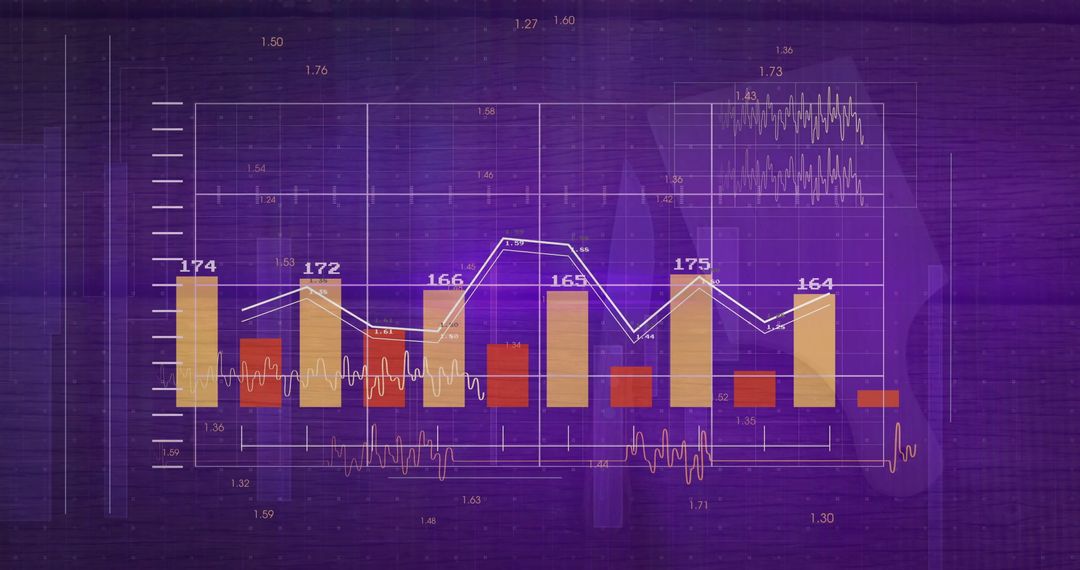
Futuristic 3D Bar Chart with Gradient on Digital Dashboard Image
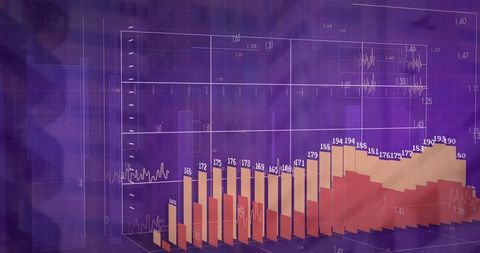
This 3D bar chart, depicted with gradient colors against a sophisticated wireframe grid, conveys analytical prowess with its futuristic dashboard design. It's perfect for illustrating concepts of data analysis, business insights, and digital technology integration. Suitable for use in presentations, corporate reports, educational tutorials, or any setting that requires a high-tech visual interpretation of statistics and data trends.
Powered by 


0
downloads
downloads
Tags:
More
Credit Photo
If you would like to credit the Photo, here are some ways you can do so
Text Link
photo Link
<span class="text-link">
<span>
<a target="_blank" href=https://pikwizard.com/photo/futuristic-3d-bar-chart-with-gradient-on-digital-dashboard/3d82a0618bd900e8b6be6b1c1a9b7fab/>PikWizard</a>
</span>
</span>
<span class="image-link">
<span
style="margin: 0 0 20px 0; display: inline-block; vertical-align: middle; width: 100%;"
>
<a
target="_blank"
href="https://pikwizard.com/photo/futuristic-3d-bar-chart-with-gradient-on-digital-dashboard/3d82a0618bd900e8b6be6b1c1a9b7fab/"
style="text-decoration: none; font-size: 10px; margin: 0;"
>
<img src="https://pikwizard.com/pw/medium/3d82a0618bd900e8b6be6b1c1a9b7fab.jpg" style="margin: 0; width: 100%;" alt="" />
<p style="font-size: 12px; margin: 0;">PikWizard</p>
</a>
</span>
</span>
Free (free of charge)
Free for personal and commercial use.
Author: Authentic Images
Similar Free Stock Images
Premium


Premium


Premium

Premium


Premium


Premium

Premium


Premium


Premium


Premium


Premium


Premium


Premium


Premium


Premium


Premium

Premium


Premium


Premium


Premium


Premium


Premium


Premium

Premium