
- Home >
- Stock Photos >
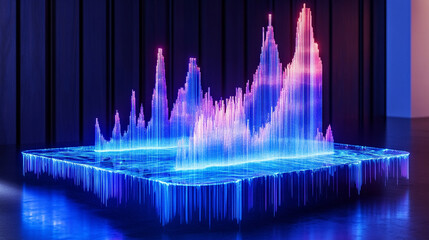
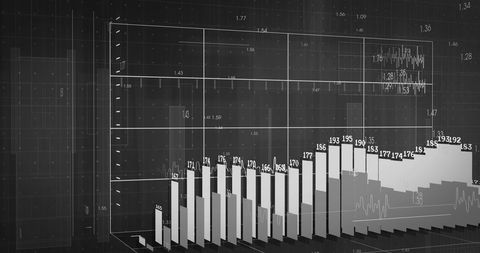
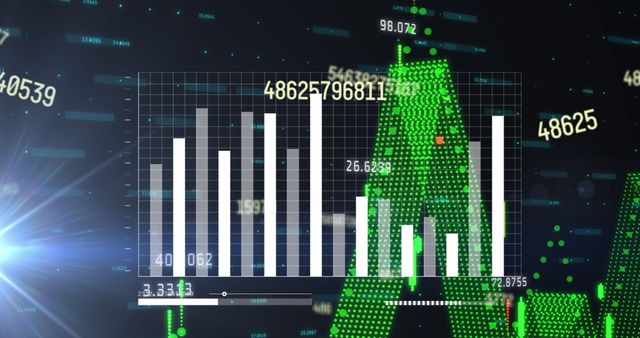
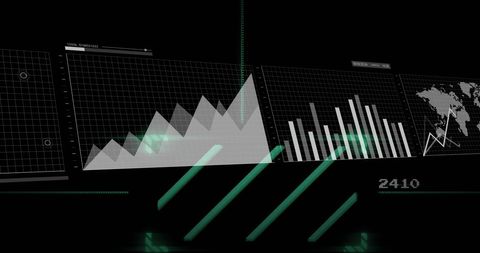
- Futuristic 3D Bar Graph with Data Analytics in Virtual Interface
Futuristic 3D Bar Graph with Data Analytics in Virtual Interface Image
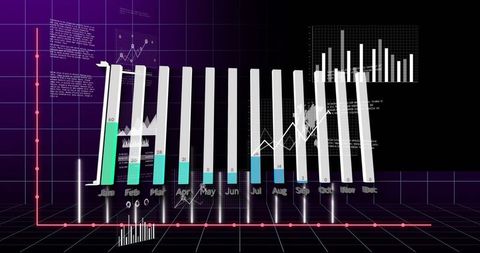
This visual illustrates a cutting-edge 3D bar graph displaying monthly data in a virtual environment. The interplay of bars with a line graph and multiple floating panels suggests complex data analysis and a futuristic approach to data visualization. Ideal for use in presentations focused on advanced analytics, technology innovations, and digital trends. Helpful for education materials, tech blogs, and seminars addressing data-driven decision-making.
Powered by 


downloads
Tags:
More
Credit Photo
If you would like to credit the Photo, here are some ways you can do so
Text Link
photo Link
<span class="text-link">
<span>
<a target="_blank" href=https://pikwizard.com/photo/futuristic-3d-bar-graph-with-data-analytics-in-virtual-interface/c604dba00f45d8031248d26a6ed8fb18/>PikWizard</a>
</span>
</span>
<span class="image-link">
<span
style="margin: 0 0 20px 0; display: inline-block; vertical-align: middle; width: 100%;"
>
<a
target="_blank"
href="https://pikwizard.com/photo/futuristic-3d-bar-graph-with-data-analytics-in-virtual-interface/c604dba00f45d8031248d26a6ed8fb18/"
style="text-decoration: none; font-size: 10px; margin: 0;"
>
<img src="https://pikwizard.com/pw/medium/c604dba00f45d8031248d26a6ed8fb18.jpg" style="margin: 0; width: 100%;" alt="" />
<p style="font-size: 12px; margin: 0;">PikWizard</p>
</a>
</span>
</span>
Free (free of charge)
Free for personal and commercial use.
Author: Awesome Content
Similar Free Stock Images

Premium


Premium
Premium


Premium


Premium


Premium


Premium


Premium

Premium
Premium


Premium


Premium


Premium


Premium


Premium


Premium


Premium


Premium


Premium


Premium


Premium

Premium


Premium

Premium

Premium


Explore More Free Stock Images