- Home >
- Stock Photos >
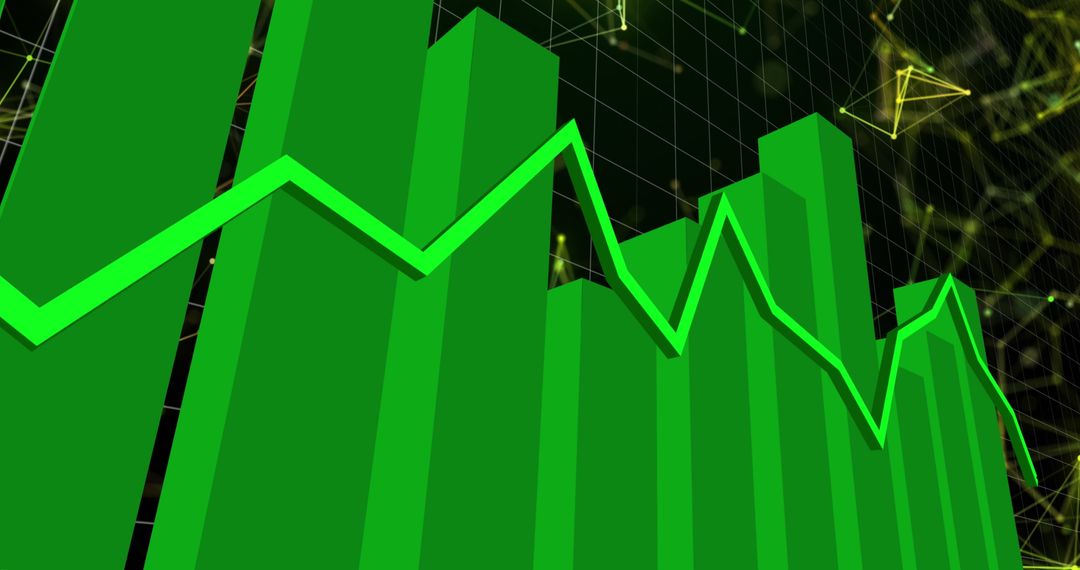
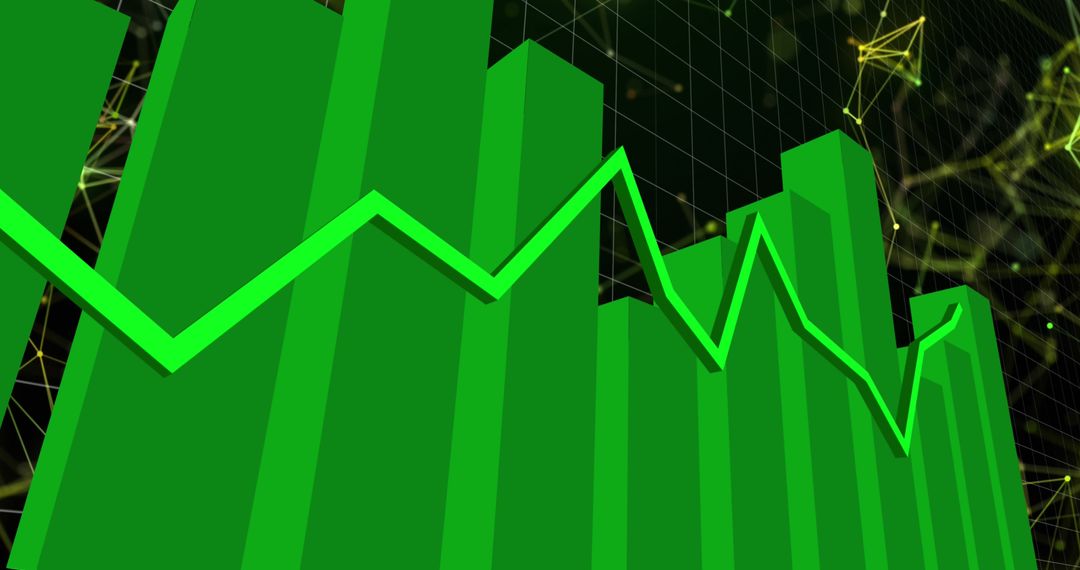
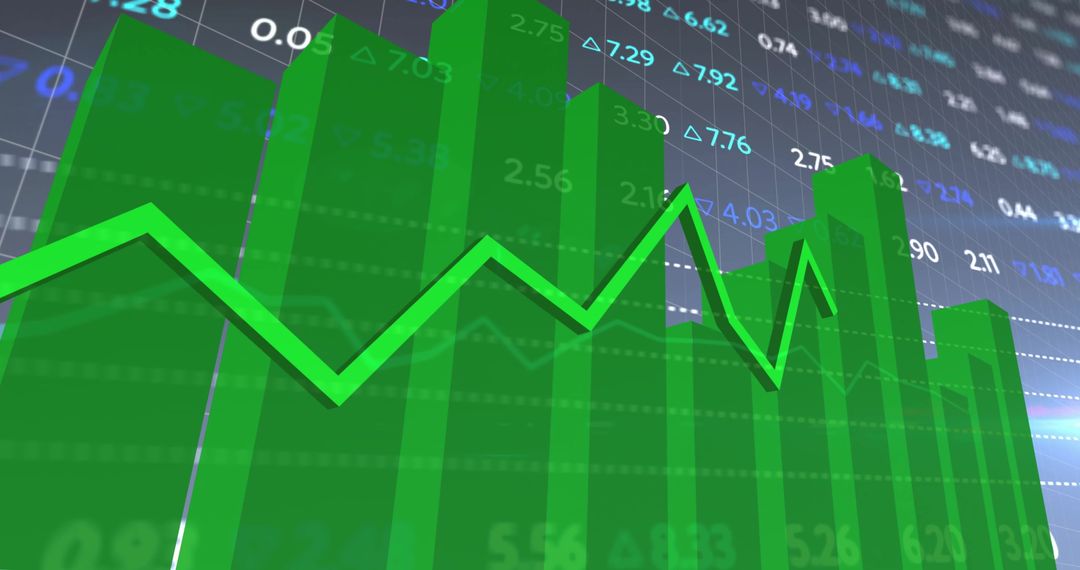
- Futuristic 3D Bar Graph With Green Line Chart
Futuristic 3D Bar Graph With Green Line Chart Image
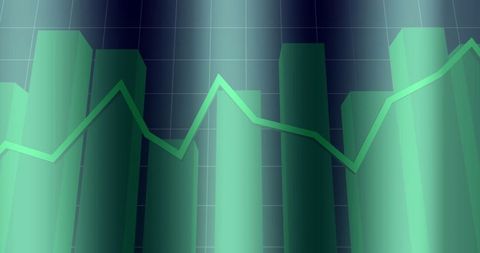
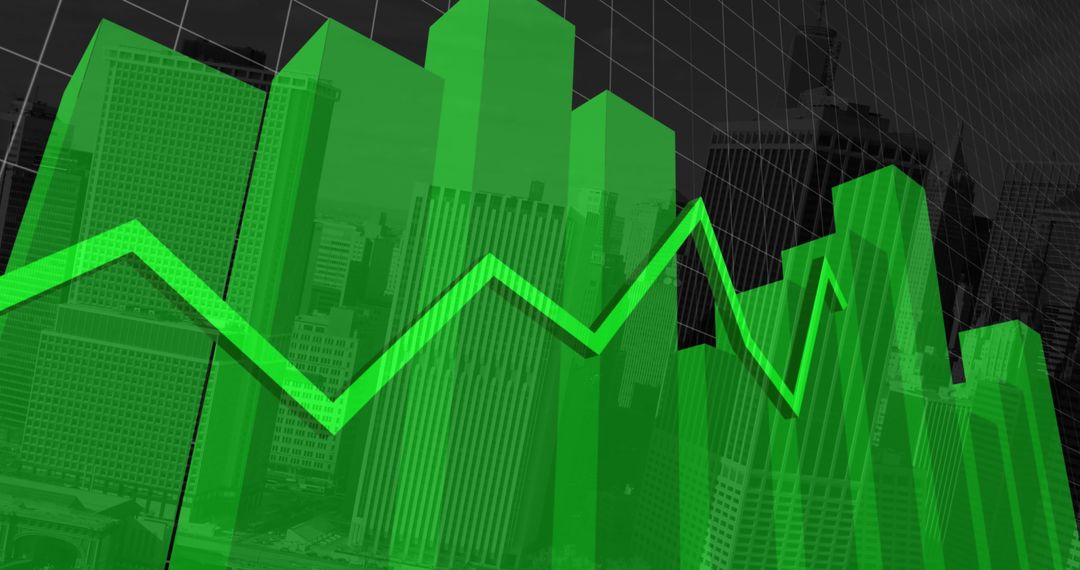
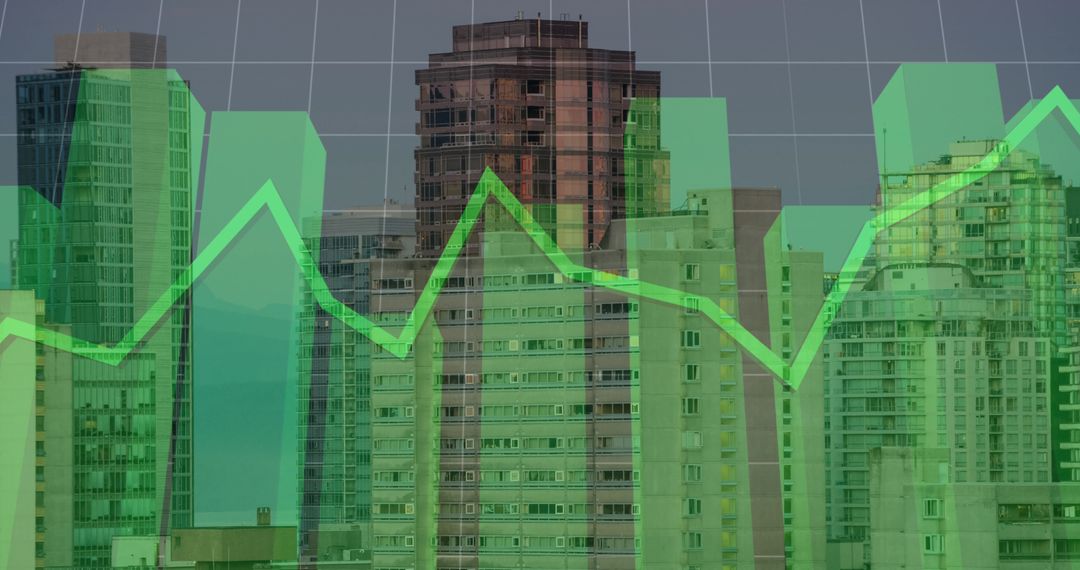
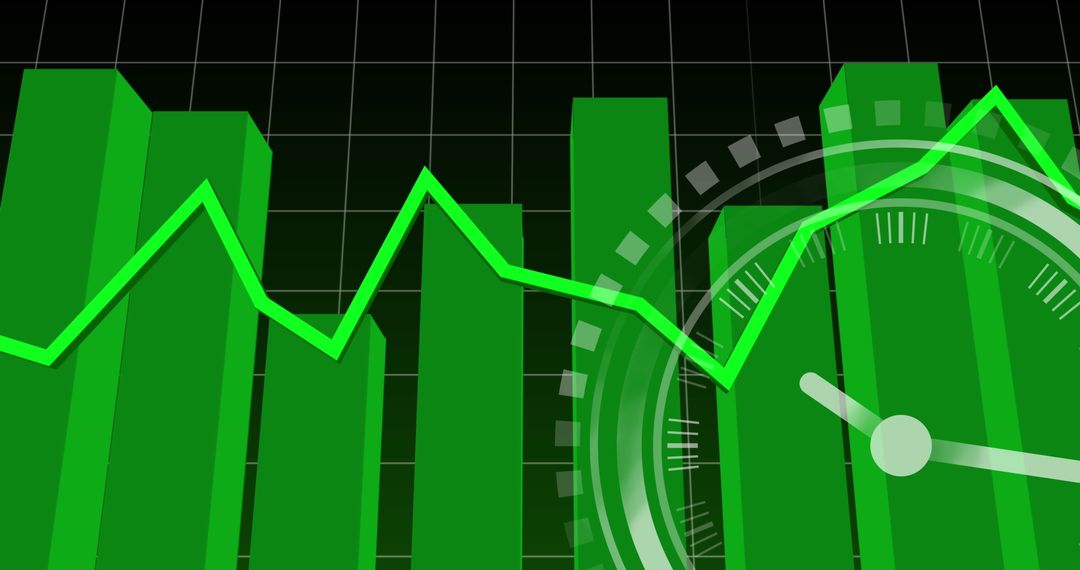
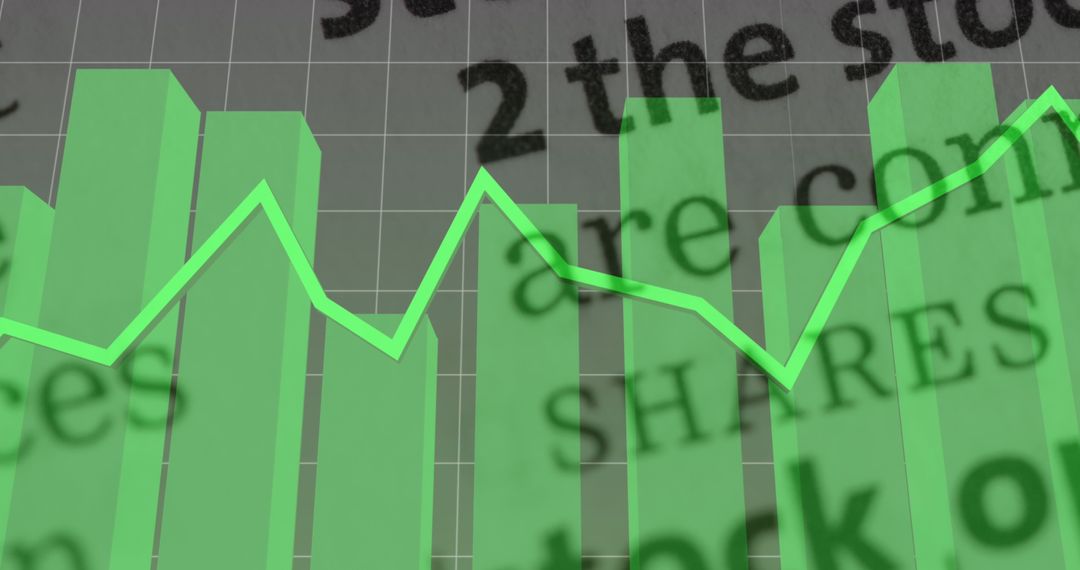
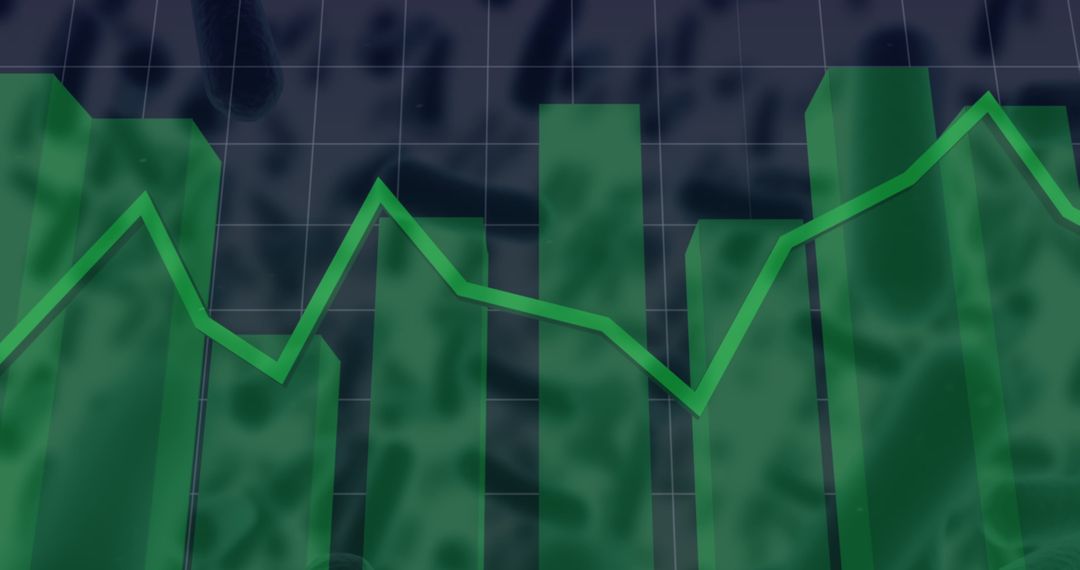
This image showcases a futuristic data visualization involving translucent cylindrical bars overlaid by a glowing green line chart. Enhanced by a dark teal grid backdrop, the composition highlights modern technology and financial analysis concepts. Ideal for use in digital presentations, reports featuring data technology, financial forecasts, or scientific publication design.
Powered by  - Get 15% off with code: PIKWIZARD15


2
downloads
downloads
Tags:
More
Credit Photo
If you would like to credit the Photo, here are some ways you can do so
Text Link
photo Link
<span class="text-link">
<span>
<a target="_blank" href=https://pikwizard.com/photo/futuristic-3d-bar-graph-with-green-line-chart/fbf2f77ded5c0800f28003d7b7955c56/>PikWizard</a>
</span>
</span>
<span class="image-link">
<span
style="margin: 0 0 20px 0; display: inline-block; vertical-align: middle; width: 100%;"
>
<a
target="_blank"
href="https://pikwizard.com/photo/futuristic-3d-bar-graph-with-green-line-chart/fbf2f77ded5c0800f28003d7b7955c56/"
style="text-decoration: none; font-size: 10px; margin: 0;"
>
<img src="https://pikwizard.com/pw/medium/fbf2f77ded5c0800f28003d7b7955c56.jpg" style="margin: 0; width: 100%;" alt="" />
<p style="font-size: 12px; margin: 0;">PikWizard</p>
</a>
</span>
</span>
Free (free of charge)
Free for personal and commercial use.
Author: Creative Art