- Home >
- Stock Photos >
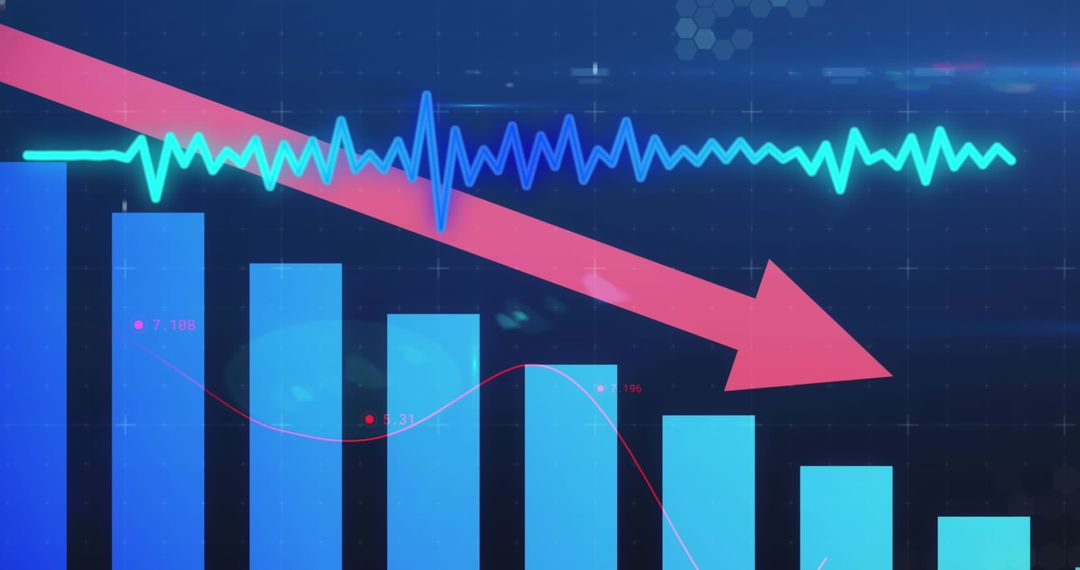
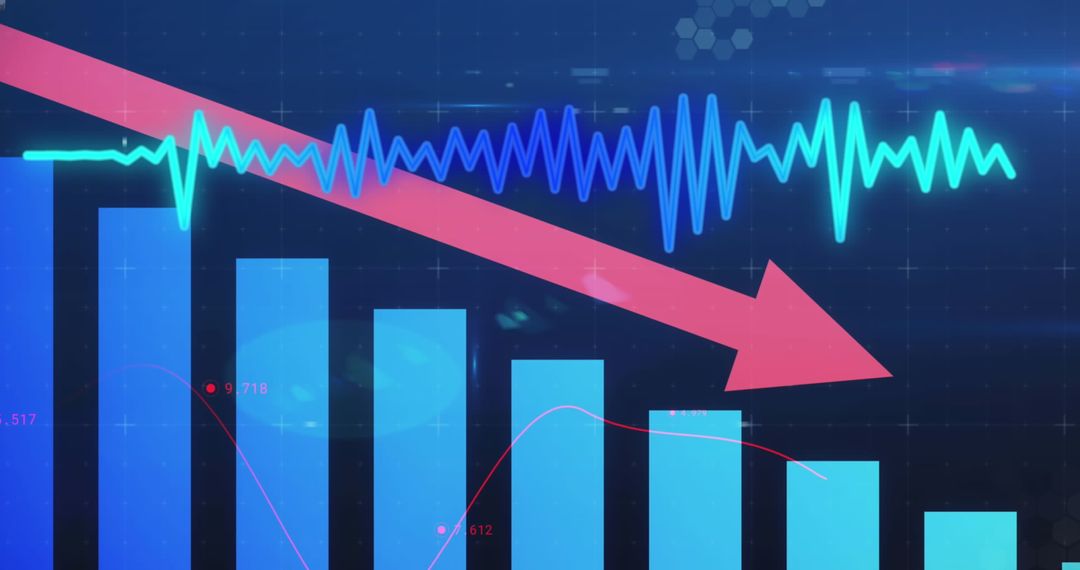
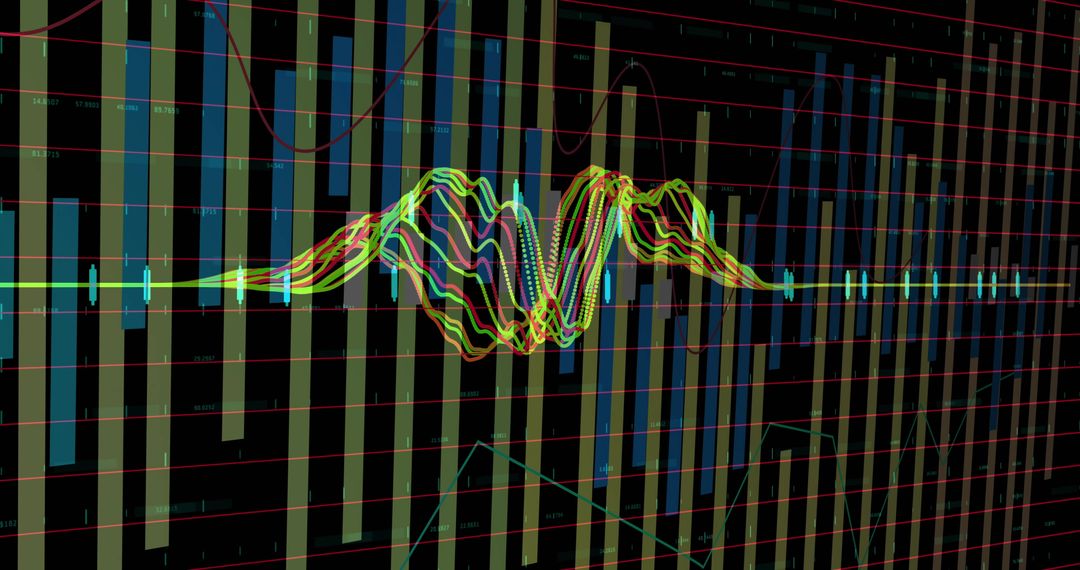
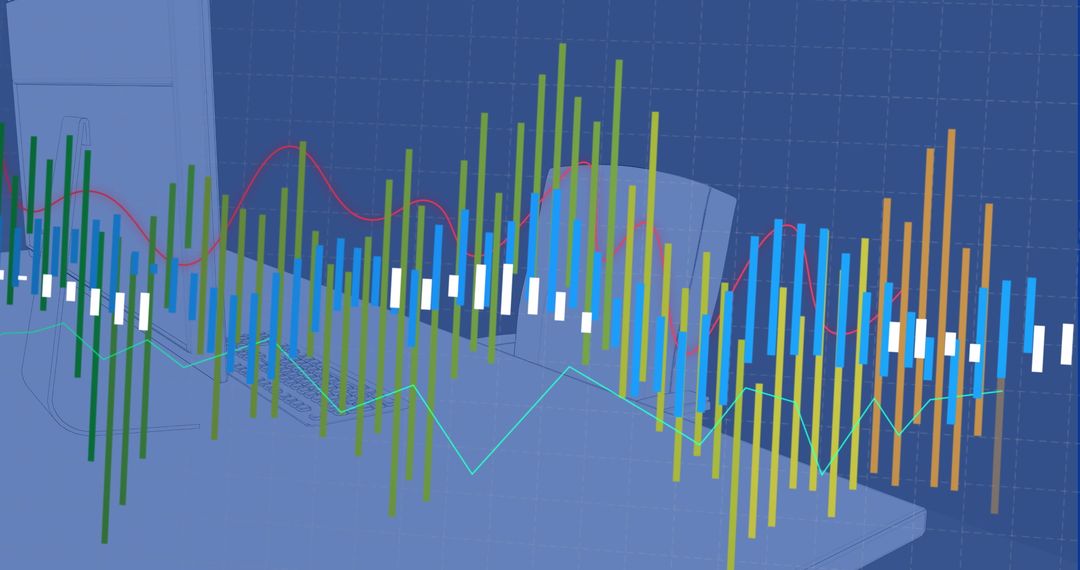
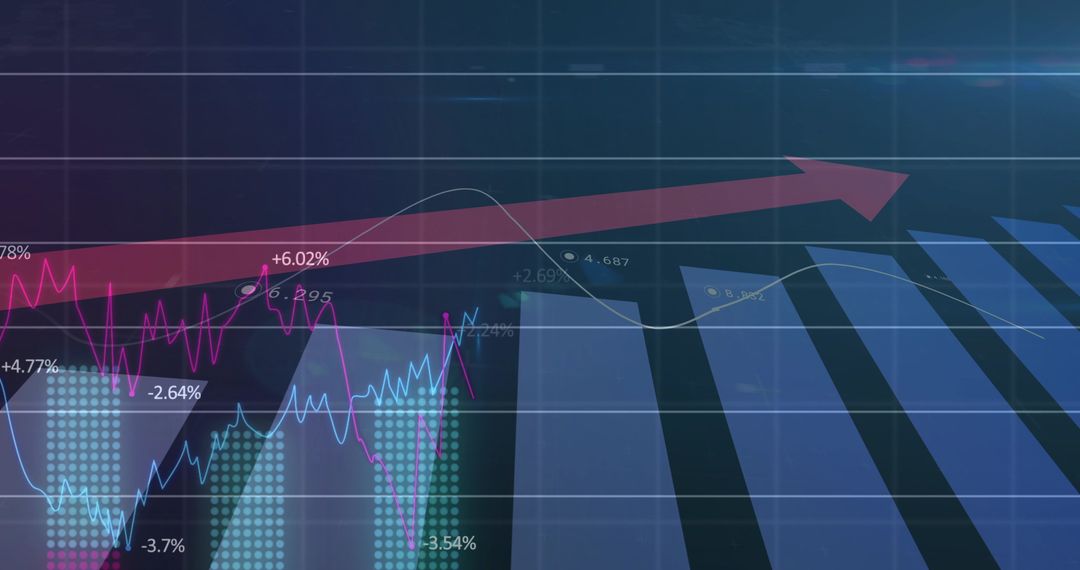
- Futuristic 3D Data Visualization with Bar and Line Graphs
Futuristic 3D Data Visualization with Bar and Line Graphs Image
This image uses layered bar and line graphs in a 3D space with dynamic colors to represent complex data behaviors. It is ideal for presentations, tech articles, financial reports, and educational materials related to data analysis, progress tracking, or conveying innovative technological solutions. The visual complexity and futuristic design emphasize the innovation in fields such as finance, tech, or information systems.
Powered by  - Get 15% off with code: PIKWIZARD15


2
downloads
downloads
Tags:
More
Credit Photo
If you would like to credit the Photo, here are some ways you can do so
Text Link
photo Link
<span class="text-link">
<span>
<a target="_blank" href=https://pikwizard.com/photo/futuristic-3d-data-visualization-with-bar-and-line-graphs/8291c79b423790d93ec739a5e5415aa7/>PikWizard</a>
</span>
</span>
<span class="image-link">
<span
style="margin: 0 0 20px 0; display: inline-block; vertical-align: middle; width: 100%;"
>
<a
target="_blank"
href="https://pikwizard.com/photo/futuristic-3d-data-visualization-with-bar-and-line-graphs/8291c79b423790d93ec739a5e5415aa7/"
style="text-decoration: none; font-size: 10px; margin: 0;"
>
<img src="https://pikwizard.com/pw/medium/8291c79b423790d93ec739a5e5415aa7.jpg" style="margin: 0; width: 100%;" alt="" />
<p style="font-size: 12px; margin: 0;">PikWizard</p>
</a>
</span>
</span>
Free (free of charge)
Free for personal and commercial use.
Author: Creative Art