
- Home >
- Stock Photos >
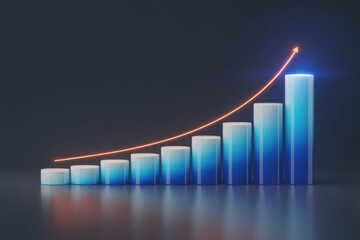
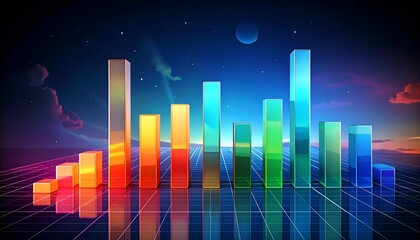
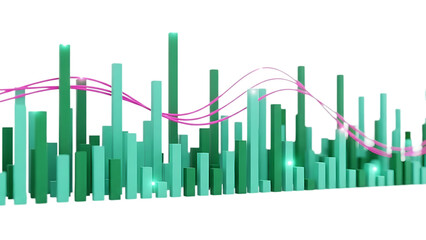
- Futuristic 3D Data Visualization with Glowing Bars
Futuristic 3D Data Visualization with Glowing Bars Image

This visualization illustrates futuristic and innovative data exploration. Featuring a 3D grid setting with glowing vertical bars, it represents advanced analytics and technological trends. Suitable for presentations or platforms focusing on data science, digital trends, innovation, technology development, research analysis, or abstract art in tech. Ideal for educational materials, corporate media, or as a symbol of technological advancement.
Powered by 


downloads
Tags:
More
Credit Photo
If you would like to credit the Photo, here are some ways you can do so
Text Link
photo Link
<span class="text-link">
<span>
<a target="_blank" href=https://pikwizard.com/photo/futuristic-3d-data-visualization-with-glowing-bars/ca726ac829e1a1eb45433449e46c14f6/>PikWizard</a>
</span>
</span>
<span class="image-link">
<span
style="margin: 0 0 20px 0; display: inline-block; vertical-align: middle; width: 100%;"
>
<a
target="_blank"
href="https://pikwizard.com/photo/futuristic-3d-data-visualization-with-glowing-bars/ca726ac829e1a1eb45433449e46c14f6/"
style="text-decoration: none; font-size: 10px; margin: 0;"
>
<img src="https://pikwizard.com/pw/medium/ca726ac829e1a1eb45433449e46c14f6.jpg" style="margin: 0; width: 100%;" alt="" />
<p style="font-size: 12px; margin: 0;">PikWizard</p>
</a>
</span>
</span>
Free (free of charge)
Free for personal and commercial use.
Author: Creative Art
Similar Free Stock Images

Premium


Premium


Premium


Premium

AI


Premium


Premium


Premium


Premium


Premium


Premium


Premium


Premium


Premium


Premium


Premium


Premium


Premium


Premium


Premium


Premium


Premium


Premium


Premium


Premium


Premium


Explore More Free Stock Images