- Home >
- Stock Photos >
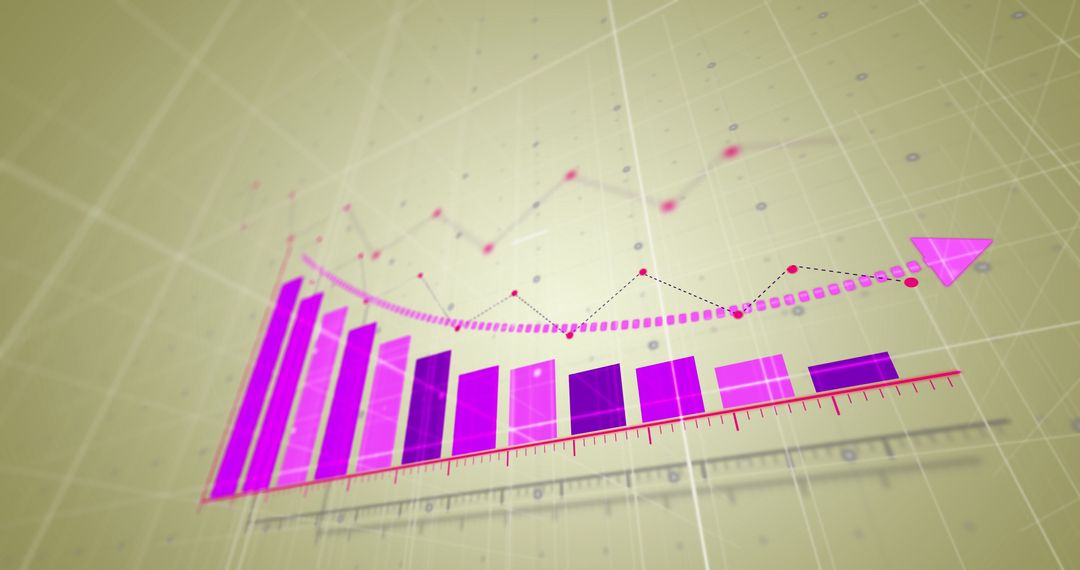
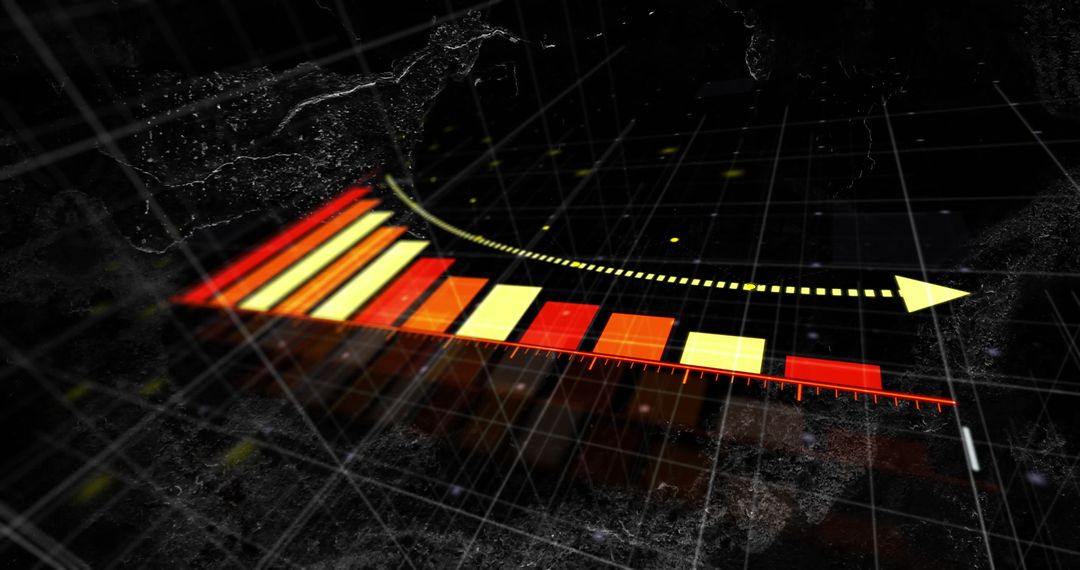
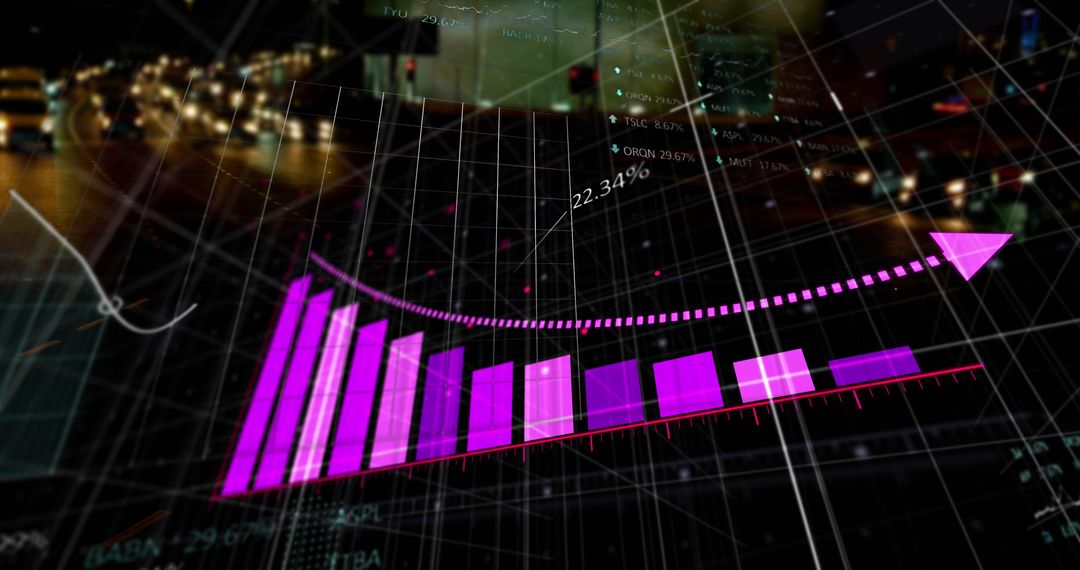
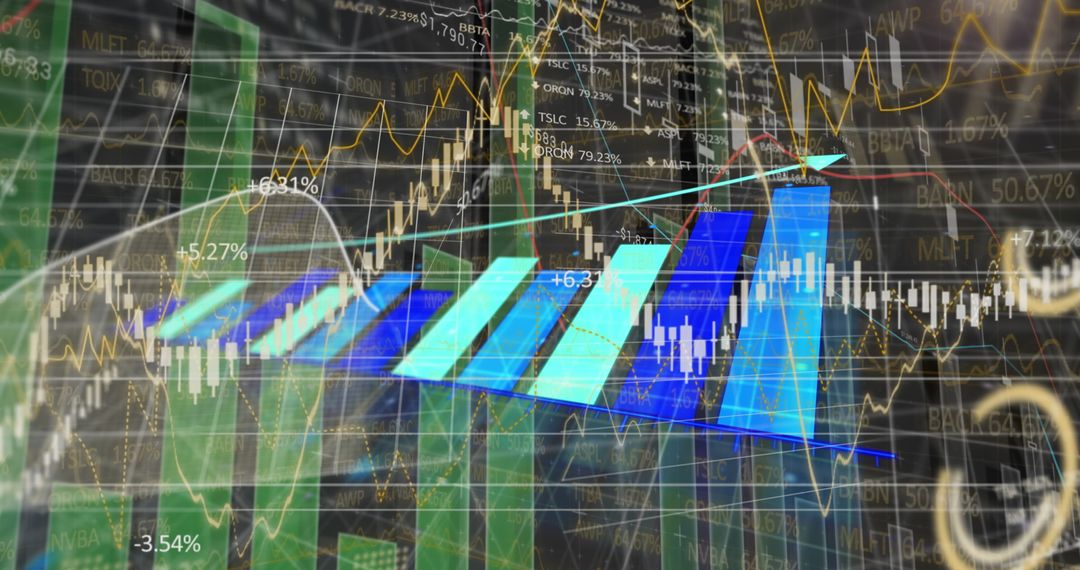
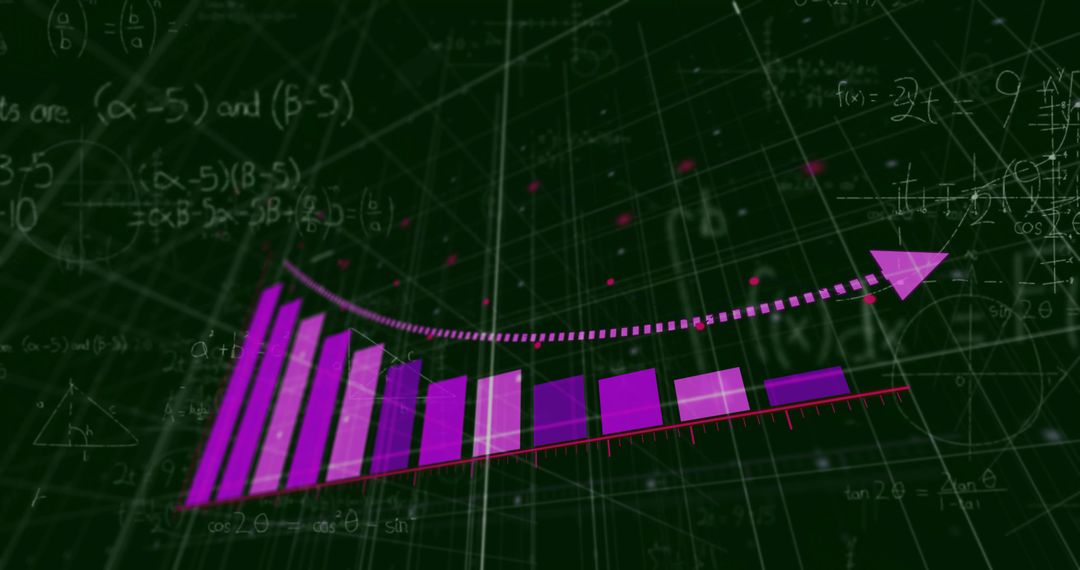
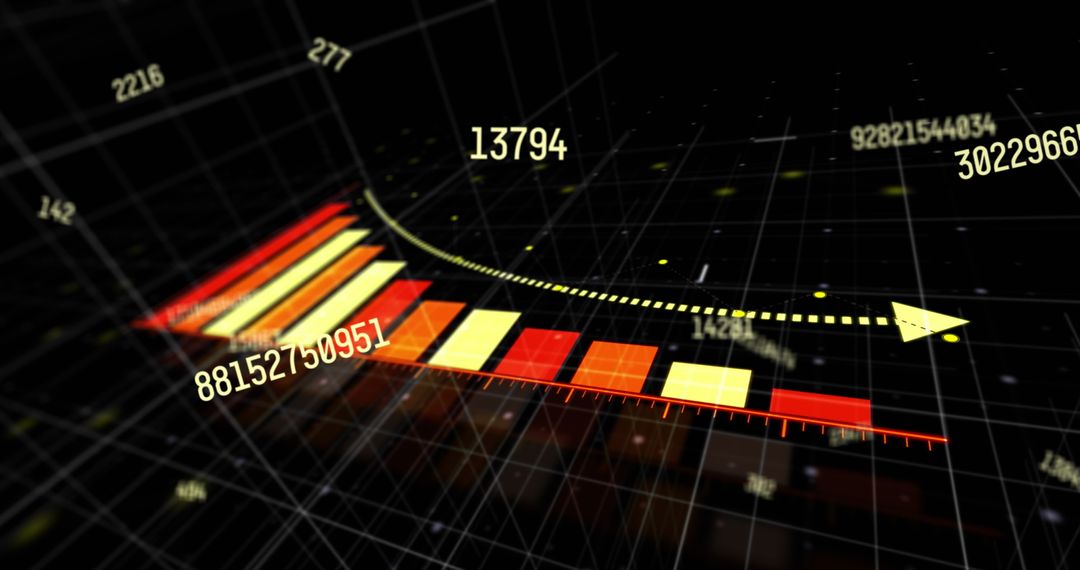
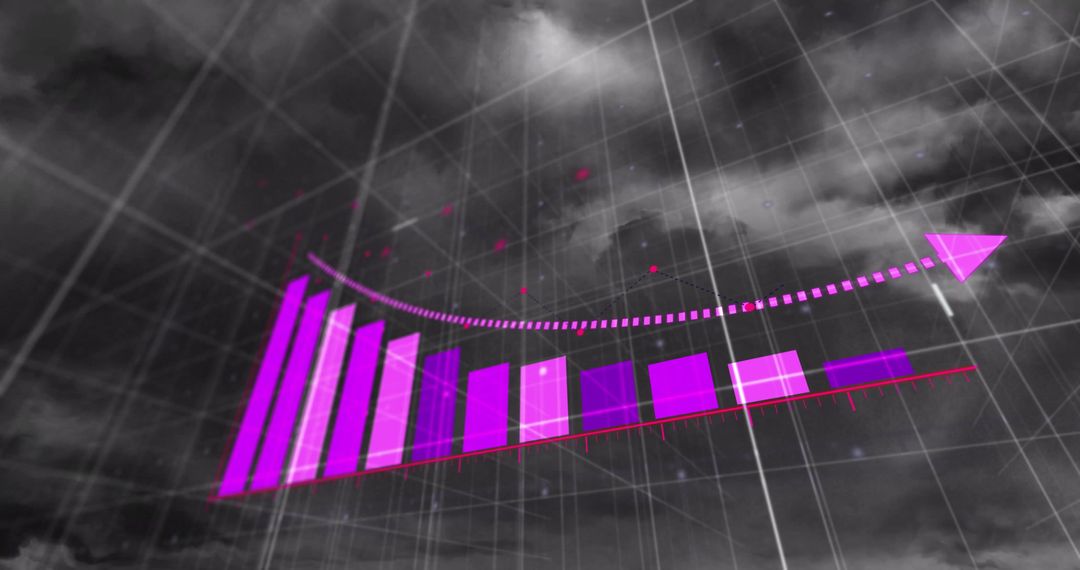
- Futuristic 3D Financial Dashboard Displaying Gradient Bar Chart with Trajectory Arrow
Futuristic 3D Financial Dashboard Displaying Gradient Bar Chart with Trajectory Arrow Image

Displaying 3D gradient bars on wireframe grid with dotted trajectory arrow, layered line graphs and neon glow for high-tech finance look. Ideal for finance presentations, market analysis reports, fintech websites, investment pitch decks, editorial pieces and social media campaigns. Providing bold visual for illustrating market trends, growth forecasts, decline scenarios and data-driven insights. Working well as hero header, slide background, infographic element, video overlay or print collateral. Crop to focus on bar cluster for detailed stats or use full composition for dramatic perspective. Use overlay text in corner for headline and complement palette with deep blue, warm red and bright yellow accents. Consider adding transparent overlay or PSD mockup for UI integration and animated sequence for video projects.
Powered by 


0
downloads
downloads
Tags:
More
Credit Photo
If you would like to credit the Photo, here are some ways you can do so
Text Link
photo Link
<span class="text-link">
<span>
<a target="_blank" href=https://pikwizard.com/photo/futuristic-3d-financial-dashboard-displaying-gradient-bar-chart-with-trajectory-arrow/ff20471dc852b7a35d5e77c546602a6a/>PikWizard</a>
</span>
</span>
<span class="image-link">
<span
style="margin: 0 0 20px 0; display: inline-block; vertical-align: middle; width: 100%;"
>
<a
target="_blank"
href="https://pikwizard.com/photo/futuristic-3d-financial-dashboard-displaying-gradient-bar-chart-with-trajectory-arrow/ff20471dc852b7a35d5e77c546602a6a/"
style="text-decoration: none; font-size: 10px; margin: 0;"
>
<img src="https://pikwizard.com/pw/medium/ff20471dc852b7a35d5e77c546602a6a.jpg" style="margin: 0; width: 100%;" alt="" />
<p style="font-size: 12px; margin: 0;">PikWizard</p>
</a>
</span>
</span>
Free (free of charge)
Free for personal and commercial use.
Author: Creative Art
Similar Free Stock Images

Premium


Premium


Premium


Premium


Premium

Premium


Premium


Premium


Premium


Premium


Premium


Premium


Premium


Premium


Premium


Premium


Premium


Premium


Premium


Premium


Premium


Premium


Premium


Premium