
- Home >
- Stock Photos >
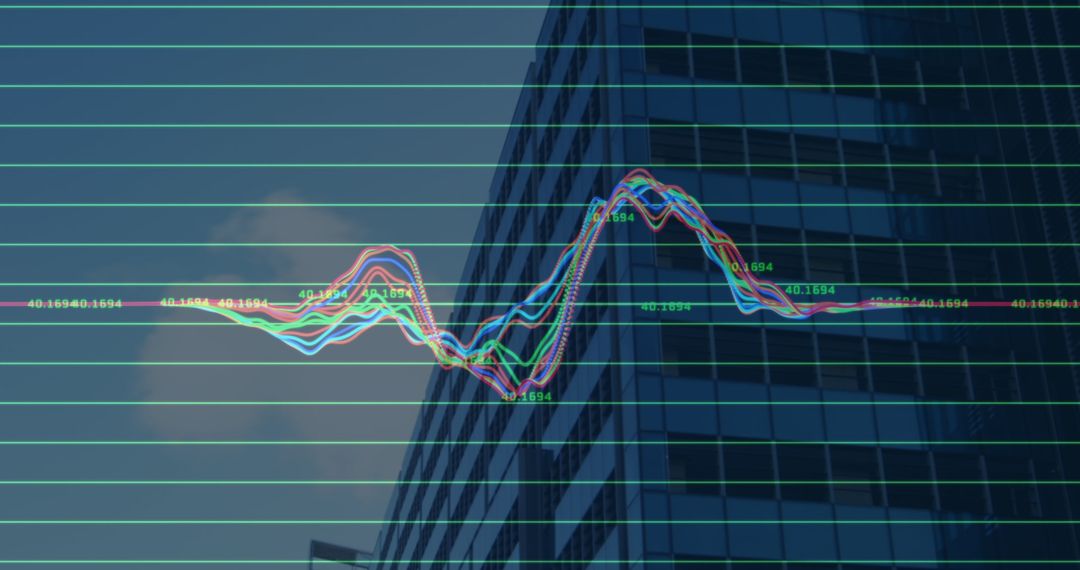
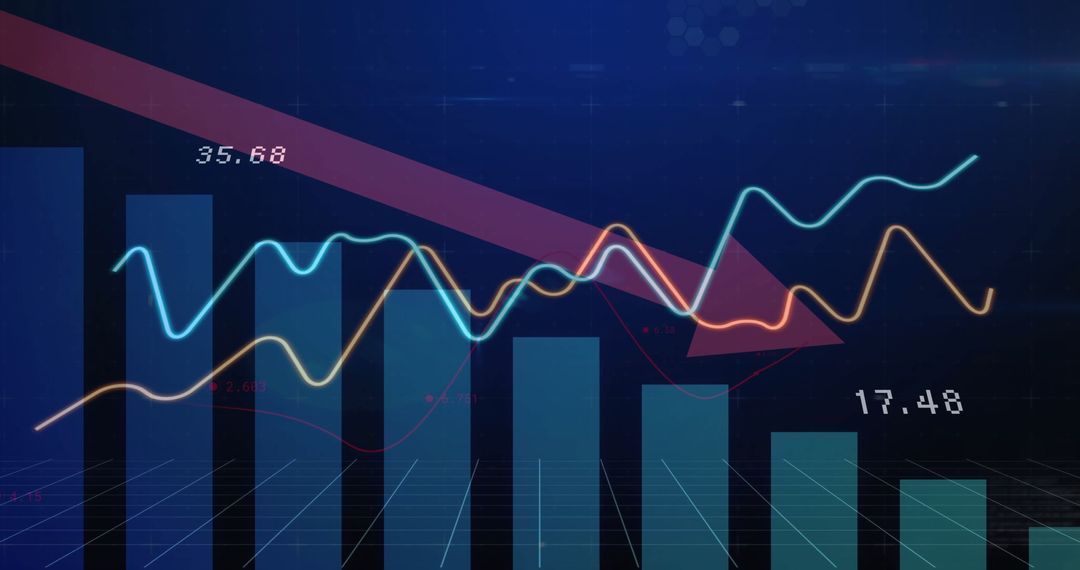
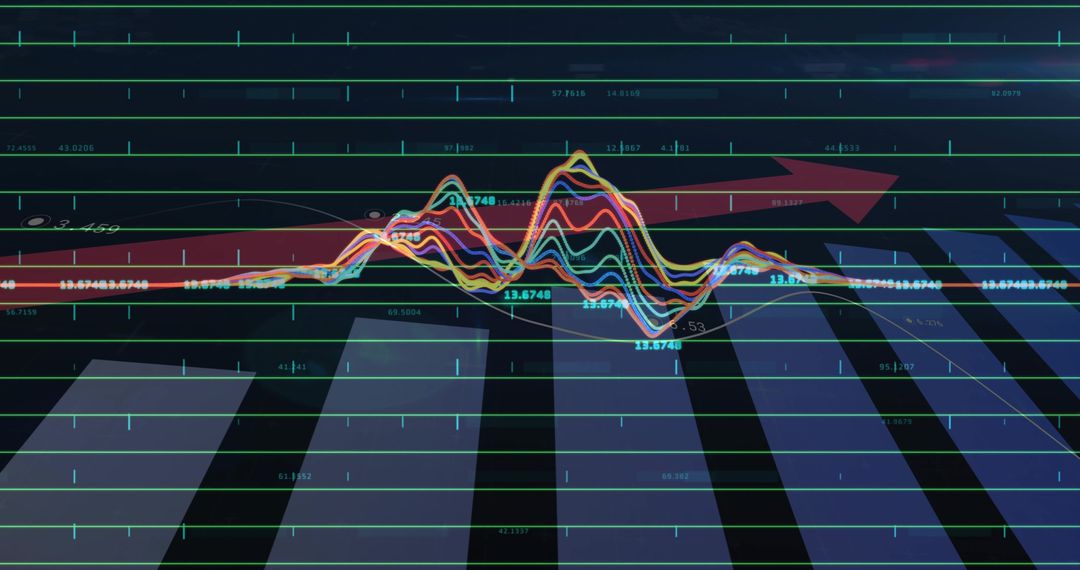
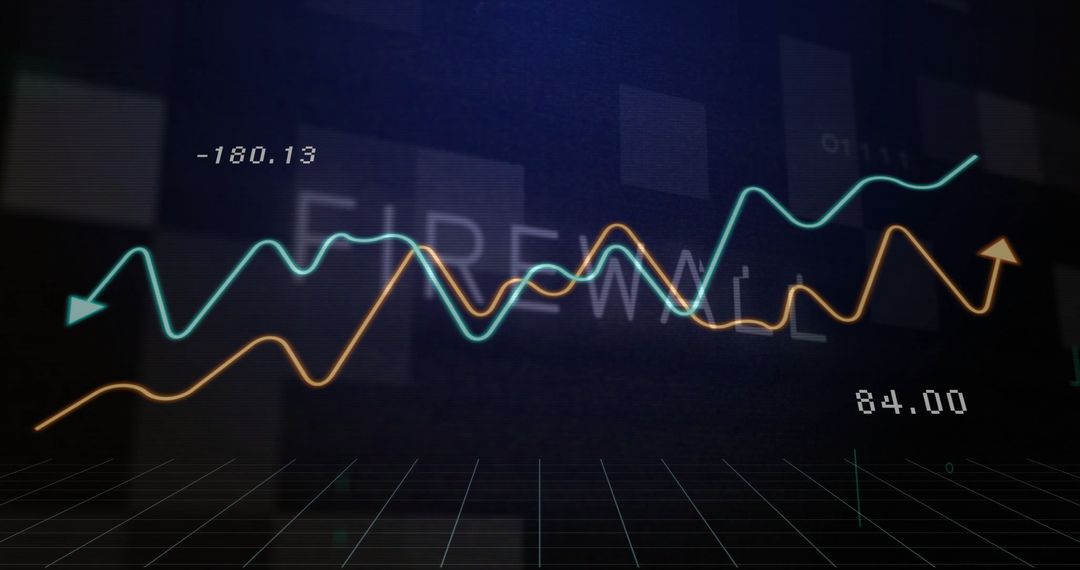
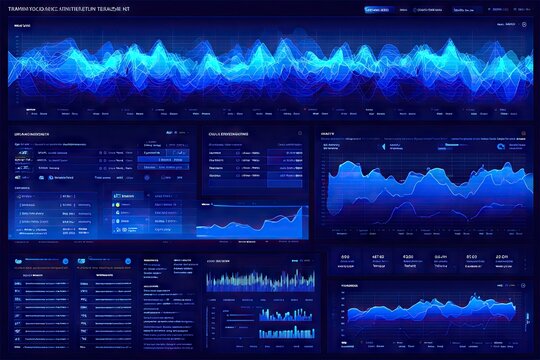
- Futuristic 3D Financial Dashboard Displaying Neon Cyan Orange Line Charts with Grid View
Futuristic 3D Financial Dashboard Displaying Neon Cyan Orange Line Charts with Grid View Image

Digital dashboard displaying neon cyan and orange line charts layered over faint bar graphs in 3D grid perspective. Composition emphasizing trend movement, crossover points and numeric overlays -138.92 and 78.31 for dramatic contrast. Serving finance presentations, market analysis reports, investment websites, fintech branding, data-driven blog headers, social media posts and corporate slide decks. Helping illustrate market volatility, forecasting scenarios, performance comparison and technology-driven analytics. Allowing color palette edits, overlaying text or logos, inserting custom data labels and resizing for banners or hero sections. Providing high-tech visual mood for fintech campaigns and investor communications.
Powered by 


0
downloads
downloads
Tags:
More
Credit Photo
If you would like to credit the Photo, here are some ways you can do so
Text Link
photo Link
<span class="text-link">
<span>
<a target="_blank" href=https://pikwizard.com/photo/futuristic-3d-financial-dashboard-displaying-neon-cyan-orange-line-charts-with-grid-view/0283249f9e589783f1c967cd2cb5eba7/>PikWizard</a>
</span>
</span>
<span class="image-link">
<span
style="margin: 0 0 20px 0; display: inline-block; vertical-align: middle; width: 100%;"
>
<a
target="_blank"
href="https://pikwizard.com/photo/futuristic-3d-financial-dashboard-displaying-neon-cyan-orange-line-charts-with-grid-view/0283249f9e589783f1c967cd2cb5eba7/"
style="text-decoration: none; font-size: 10px; margin: 0;"
>
<img src="https://pikwizard.com/pw/medium/0283249f9e589783f1c967cd2cb5eba7.jpg" style="margin: 0; width: 100%;" alt="" />
<p style="font-size: 12px; margin: 0;">PikWizard</p>
</a>
</span>
</span>
Free (free of charge)
Free for personal and commercial use.
Author: Creative Art
Similar Free Stock Images

Premium


Premium


Premium


Premium


Premium


Premium


Premium


Premium


Premium


Premium


Premium


Premium


Premium


Premium


Premium


Premium


Premium


Premium


Premium


Premium


Premium


Premium


Premium


Premium

