
- Home >
- Stock Photos >
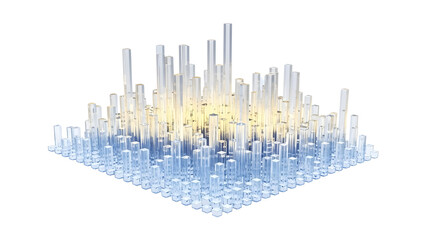
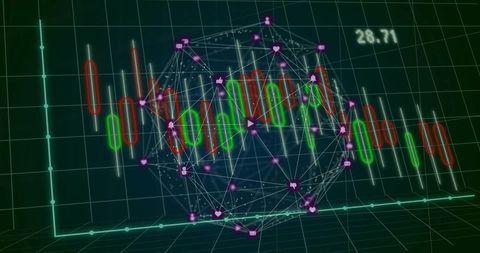
- Futuristic 3D Financial Data Visualization Abstract
Futuristic 3D Financial Data Visualization Abstract Image

This abstract digital art piece features a futuristic portrayal of financial analytics using 3D elements and vibrant colors. White candlesticks hover amid swirling turquoise dots and floating waveforms, accented by a red trendline. This image can be ideal for presentations related to technological advancements in financial services, digital data analysis, stock market trends, or software design for trading platforms. Dynamic and engaging, it serves excellently as a concept for illustrating modern interaction with in-depth market data.
Powered by 


downloads
Tags:
More
Credit Photo
If you would like to credit the Photo, here are some ways you can do so
Text Link
photo Link
<span class="text-link">
<span>
<a target="_blank" href=https://pikwizard.com/photo/futuristic-3d-financial-data-visualization-abstract/74b7657267a763457b8bac85c12cf873/>PikWizard</a>
</span>
</span>
<span class="image-link">
<span
style="margin: 0 0 20px 0; display: inline-block; vertical-align: middle; width: 100%;"
>
<a
target="_blank"
href="https://pikwizard.com/photo/futuristic-3d-financial-data-visualization-abstract/74b7657267a763457b8bac85c12cf873/"
style="text-decoration: none; font-size: 10px; margin: 0;"
>
<img src="https://pikwizard.com/pw/medium/74b7657267a763457b8bac85c12cf873.jpg" style="margin: 0; width: 100%;" alt="" />
<p style="font-size: 12px; margin: 0;">PikWizard</p>
</a>
</span>
</span>
Free (free of charge)
Free for personal and commercial use.
Author: People Creations
Similar Free Stock Images

Premium


Premium

Premium


Premium


Premium


Premium


Premium


Premium

Premium

Premium


Premium


Premium


Premium


Premium


Premium


Premium


Premium


Premium


Premium


Premium


Premium


Premium


Premium


Premium


Premium


Explore More Free Stock Images