- Home >
- Stock Photos >
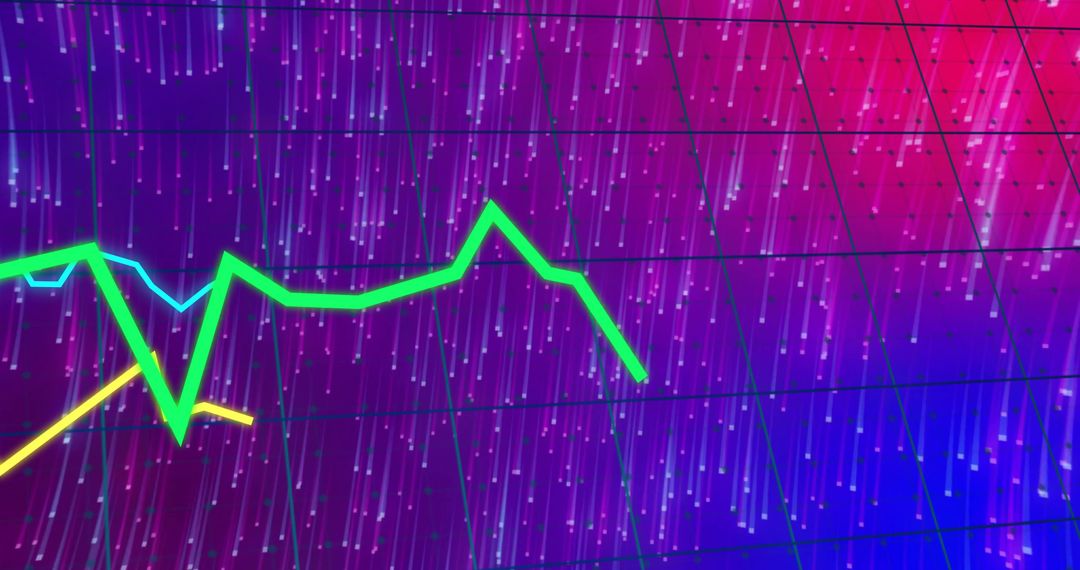
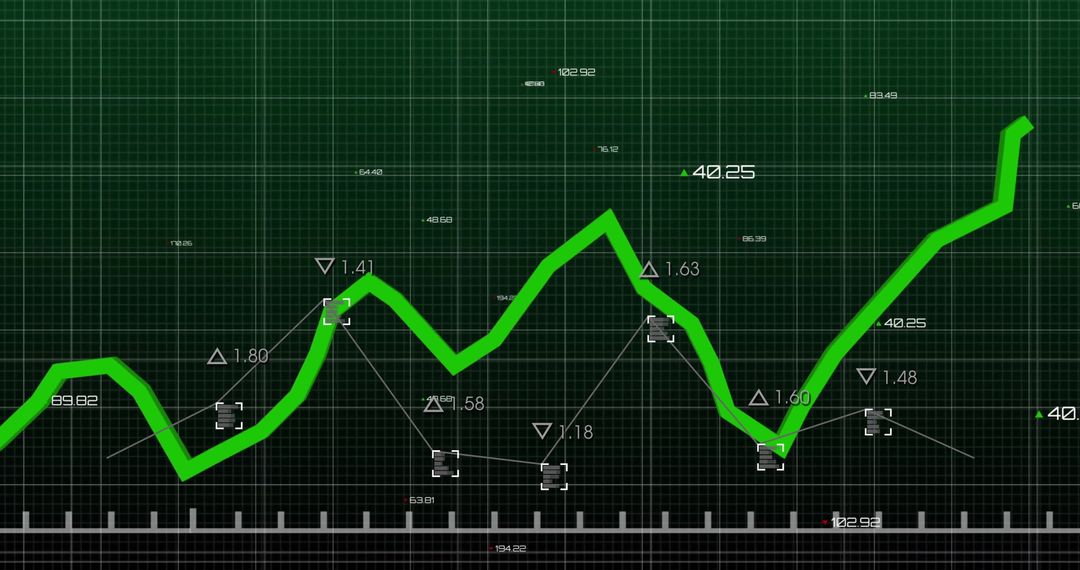
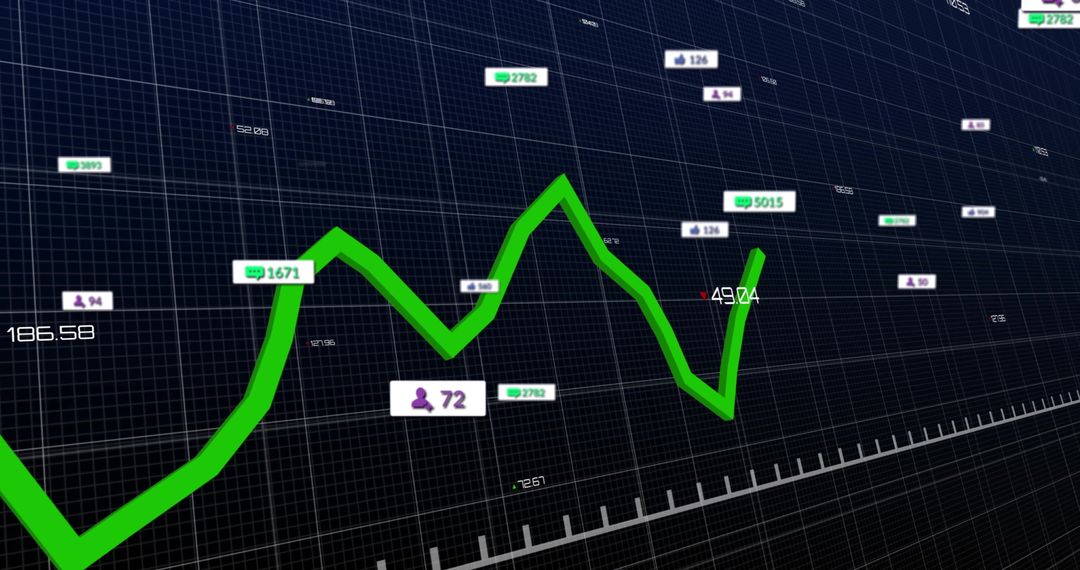
- Futuristic 3D Green Line Chart Showing Financial Growth on Purple Grid Dashboard
Futuristic 3D Green Line Chart Showing Financial Growth on Purple Grid Dashboard Image

Showing bold 3D green polyline flowing across deep purple grid plane, annotated with percent labels, up and down arrows, and subtle mesh connections. Highlighting market movement, performance spikes, and volatility patterns for finance and data projects. Working well for fintech websites, investor presentations, financial reports, business blogs, data dashboards, and social media campaigns. Suggesting design use: crop tight on peak for emphasis, overlay strong headline in white or neon green, pair with clean sans-serif fonts, animate line for web hero or video intros. Conveying dynamic, futuristic, technology-driven mood while keeping focus on upward growth and analytics insight.
Powered by  - Get 15% off with code: PIKWIZARD15


0
downloads
downloads
Tags:
More
Credit Photo
If you would like to credit the Photo, here are some ways you can do so
Text Link
photo Link
<span class="text-link">
<span>
<a target="_blank" href=https://pikwizard.com/photo/futuristic-3d-green-line-chart-showing-financial-growth-on-purple-grid-dashboard/72ebd0321ec56e6b36edb635103eb19b/>PikWizard</a>
</span>
</span>
<span class="image-link">
<span
style="margin: 0 0 20px 0; display: inline-block; vertical-align: middle; width: 100%;"
>
<a
target="_blank"
href="https://pikwizard.com/photo/futuristic-3d-green-line-chart-showing-financial-growth-on-purple-grid-dashboard/72ebd0321ec56e6b36edb635103eb19b/"
style="text-decoration: none; font-size: 10px; margin: 0;"
>
<img src="https://pikwizard.com/pw/medium/72ebd0321ec56e6b36edb635103eb19b.jpg" style="margin: 0; width: 100%;" alt="" />
<p style="font-size: 12px; margin: 0;">PikWizard</p>
</a>
</span>
</span>
Free (free of charge)
Free for personal and commercial use.
Author: People Creations
Similar Free Stock Images

Premium


Premium


Premium


Premium


Premium


Premium


Premium


Premium


Premium


Premium


Premium


Premium


Premium


Premium


Premium


Premium


Premium


Premium


Premium


Premium


Premium


Premium


Premium


Premium