
- Home >
- Stock Photos >
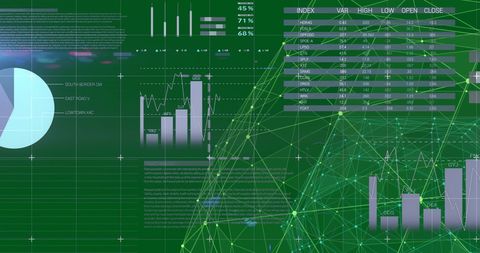
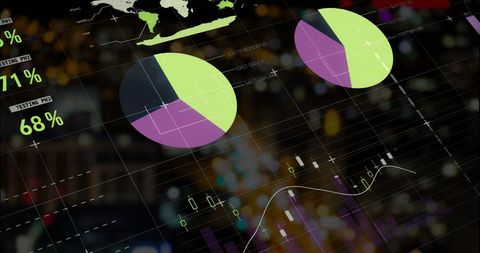
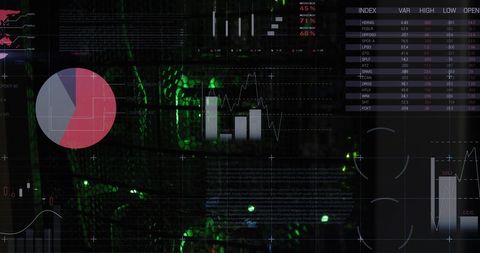
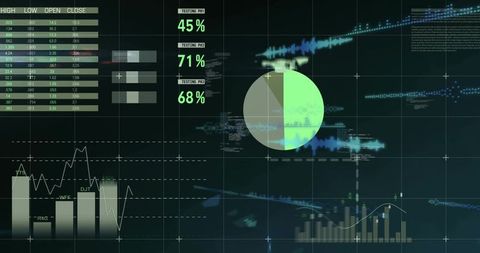
- Futuristic Analytics Dashboard Interface with Charts
Futuristic Analytics Dashboard Interface with Charts Image

This digital artwork features a modern analytics dashboard with overlapping pie charts and graphical elements such as a world map, line graphs, and bar charts. It visually represents data in a futuristic way, ideal for illustrating articles, presentations, and projects related to data analysis, technology innovations, or business intelligence tools. Developers and IT specialists may find this useful for client meetings and product launches.
Powered by 


downloads
Tags:
More
Credit Photo
If you would like to credit the Photo, here are some ways you can do so
Text Link
photo Link
<span class="text-link">
<span>
<a target="_blank" href=https://pikwizard.com/photo/futuristic-analytics-dashboard-interface-with-charts/70249fa3adeb890b04132b4885009fcf/>PikWizard</a>
</span>
</span>
<span class="image-link">
<span
style="margin: 0 0 20px 0; display: inline-block; vertical-align: middle; width: 100%;"
>
<a
target="_blank"
href="https://pikwizard.com/photo/futuristic-analytics-dashboard-interface-with-charts/70249fa3adeb890b04132b4885009fcf/"
style="text-decoration: none; font-size: 10px; margin: 0;"
>
<img src="https://pikwizard.com/pw/medium/70249fa3adeb890b04132b4885009fcf.jpg" style="margin: 0; width: 100%;" alt="" />
<p style="font-size: 12px; margin: 0;">PikWizard</p>
</a>
</span>
</span>
Free (free of charge)
Free for personal and commercial use.
Author: Authentic Images
Similar Free Stock Images

Premium


Premium

Premium


Premium

Premium


Premium


Premium


Premium


Premium


Premium

Premium


Premium


Premium


Premium

Premium

Premium


Premium


Premium


Premium


Premium


Premium


Premium

Premium


Premium


Premium


Explore More Free Stock Images