- Home >
- Stock Photos >
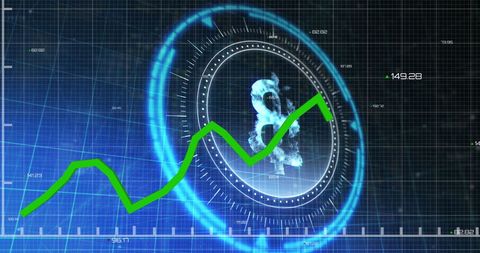
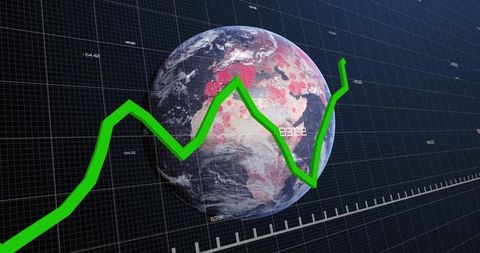
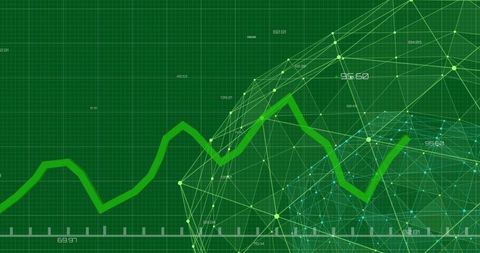
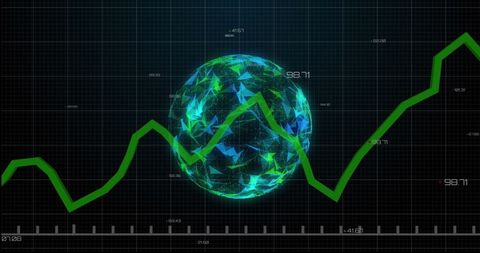
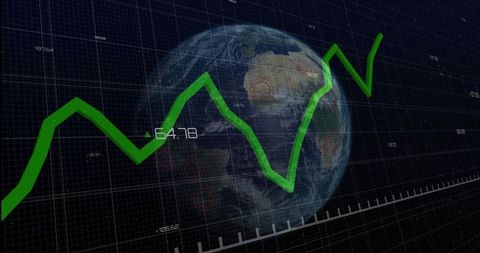
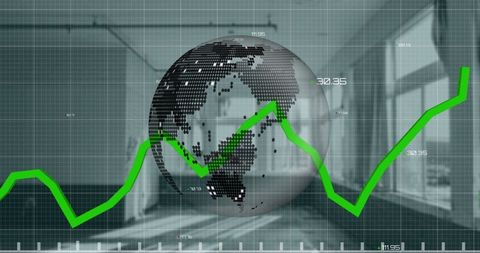
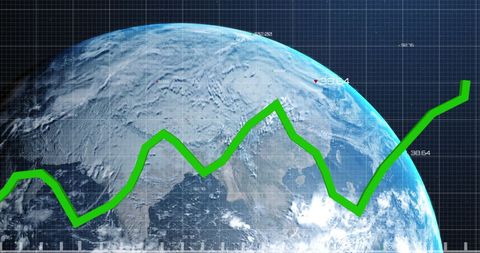
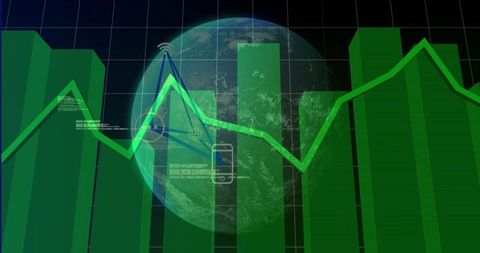
- Futuristic Analytics Dashboard with Earth and Green Graph
Futuristic Analytics Dashboard with Earth and Green Graph Image
Depicting an advanced analytical dashboard overlaying Earth with a prominent green line graph, this visual symbolizes technological advancement and data intelligence. The detailed digital display is ideal for use in science and technology presentations, futuristic media projects, educational materials on data analytics, and visual assets focusing on global data insights.

downloads
Tags:
More
Credit Photo
If you would like to credit the Photo, here are some ways you can do so
Text Link
photo Link
<span class="text-link">
<span>
<a target="_blank" href=https://pikwizard.com/photo/futuristic-analytics-dashboard-with-earth-and-green-graph/7e7fd05cd8fd055b3bbc6e696a3cde1f/>PikWizard</a>
</span>
</span>
<span class="image-link">
<span
style="margin: 0 0 20px 0; display: inline-block; vertical-align: middle; width: 100%;"
>
<a
target="_blank"
href="https://pikwizard.com/photo/futuristic-analytics-dashboard-with-earth-and-green-graph/7e7fd05cd8fd055b3bbc6e696a3cde1f/"
style="text-decoration: none; font-size: 10px; margin: 0;"
>
<img src="https://pikwizard.com/pw/medium/7e7fd05cd8fd055b3bbc6e696a3cde1f.jpg" style="margin: 0; width: 100%;" alt="" />
<p style="font-size: 12px; margin: 0;">PikWizard</p>
</a>
</span>
</span>
Free (free of charge)
Free for personal and commercial use.
Author: Creative Art