1. Home > 
  2. Stock Photos > 
  3. Futuristic Analytics Dashboard with Graphs and Network Interface

Futuristic Analytics Dashboard with Graphs and Network Interface Image

Futuristic Analytics Dashboard with Graphs and Network Interface

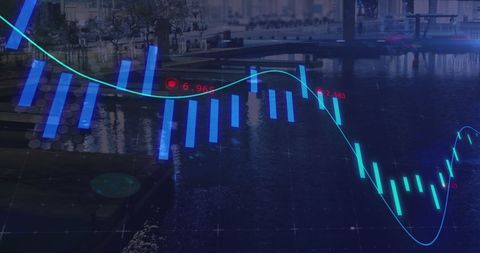
This visual depicts a cutting-edge analytics dashboard, including vertical bars, line graphs, and digital data points, all interconnected through a hexagonal pattern. Ideal for illustrating themes related to data analysis, technology, and innovation. Suitable for presentations, websites, and articles focused on tech advancements and future-oriented designs.

Powered by Shutterstock logo - Get 15% off with code: PIKWIZARD15
Artificial intelligence and data science concept. A laptop screen shows an AI dashboard with machine learning models and big data analysis for business intelligence and predictive analytics. - Powered by Shutterstock - Get 15% off with code: PIKWIZARD15A close-up view of a hand interacting with a digital tablet displaying various data visualizations, ideal for exploring business analytics and technology. - Powered by Shutterstock - Get 15% off with code: PIKWIZARD15Rotating 3D Earth globe showcasing network dashboard, with binary code and social media pop-ups. Global, technology, futuristic, innovation, data, connectivity, analytics - Powered by Shutterstock - Get 15% off with code: PIKWIZARD15Data analytics and big data strategy for real-time analytics, predictive data modeling, business intelligence analytics, and data-driven decision-making in modern digital businesses. Spline - Powered by Shutterstock - Get 15% off with code: PIKWIZARD15Ai using. Business team using technology artificial intelligence with digital Ai assistant. Futuristic innovation AI technology collaboration and biz ideas for future. Business Tech Startup meeting. - Powered by Shutterstock - Get 15% off with code: PIKWIZARD15

Credit Photo

If you would like to credit the Photo, here are some ways you can do so

Free (free of charge)

Free for personal and commercial use.

Author: Creative Art

Similar Free Stock Images

Futuristic Financial Analysis Concept with Neon and Digital Graphs
Premium
A hand interacts with futuristic virtual data screens displaying analytics and charts on a dark background.
Futuristic Data Analytics Dashboard with Digital Interface
3D Grid with Dynamic Financial Data Visualization
Premium
AI data analysis concept with futuristic dashboard and digital charts, businessman using laptop to process big data, performance metrics, and intelligent insights for smart business.
Futuristic Trading Dashboard with Analytics and Graphs
Digital Financial Data with Stock Market Graph on Green Background
Economic Decline Illustrated with Chart and Red Arrow
Futuristic Trading and Data Analysis Platform with Trend Visualizations
Premium
Business person using laptop with digital SME interface, futuristic style, dark background, concept of small and medium enterprise growth
Futuristic Financial Data Visualization with Neon Elements
Digital Financial Dashboard Showing Chart with Candlestick Bars and Data Visualizations
Global Financial Data Process with Digital Interface and Statistics
Rising Earnings Chart on Digital Trading Screen with Cryptocurrency Tickers
Premium
Person using futuristic digital dashboard with 2026 analytics and charts, holographic style, over dark blurred background, showing innovation
Abstract Global Network and Data Interface Design
Digital Candlestick Chart Visualization on Futuristic Dashboard
Futuristic Financial Data Processing Over Cityscape
Digital Financial Analysis with Vibant Graphs and Data Points
Premium
Two professionals in dark suits pointing at dynamic data visualizations on interactive digital interface with glowing blue elements against dark background. Concept of business, technologies, data. Ad
Premium
Big data and analytics support real-time insights, predictive modeling, and data-driven decisions for business intelligence and growth. Latch
Trading Interface with Candlesticks and Social Icons on Digital Grid Background
Digital Financial Graphs Over City Skyscrapers Showing Business Trends
Teal Candlestick Market Chart Showing Dip and Recovery on Futuristic Trading Dashboard
Futuristic Financial Dashboard Displaying Interactive Data Graph
Abstract Financial Chart with Growing Cryptocurrency Trends
Digital Financial Data Analysis with Chart and Markers
Rising Candlestick Chart on Dynamic Digital Financial Display
Dynamic Financial Processing and Analytics Concept
Abstract Financial Graph with Data Points over Digital Background
Financial Market Trends Over City Lights Digital Interface Concept
Financial Data Visualization with Dynamic Graphical Analysis
Dynamic Stock Market Charts and Financial Data Representation
Digital Stock Market Chart with Candlesticks and Line Graph
Dynamic Digital Financial Chart with Market Trends and Data Analysis
Futuristic Stock Market Graph Overlay
Futuristic Financial Data Visualization with Large Letter A
Digital Financial Data Visualization with Global Connectivity
Premium
Multiple hands interacting with digital business dashboard featuring real-time analytics, data visualization, and futuristic glowing interface. Concept of business, technologies, data, engineering. Ad
Composite of Financial Graphs and Code with City Night Traffic
Globe and Market Trends: Futuristic Financial Data Visualization
Dynamic Financial Market Charts with Price Swings
Digital COVID-19 Data With Graphs and Charts
Digital Financial Data Processing in Global Market Environment
Financial Data Fluctuating on Modern Digital Dashboard Interface
Global Financial Data Processing Digital Interface
Dynamic Stock Market Chart with Shoe Icons Overlay
Futuristic Financial Data Visualization Background
Premium
Futuristic business interface with real-time data analytics on touchscreen, tech presentations, websites, and innovation branding.
Financial Data Overlay with Business Growth Charts in Modern Cityscape
Digital Stock Market Analysis Over City Skyline
Digital Financial Data Analysis with Candlestick Graph and Trend Line
Digital Financial Data Display with Trend Analysis
Premium
A hand interacts with glowing holographic data graphs and charts, showcasing futuristic digital visualization on a dark background. Concept of innovation
Financial Data Visualization Over Urban Skyline with Digital Elements
Digital Finance Interface Display with Data Visualization
Abstract Digital Market Analysis with Financial Charts
Financial Data Technology with Digital Interface Graphs
Premium
Close Up on Person's Hands Using a Laptop Computer with Analytical Data Presented in Futuristic Holographic Visualization with Graphs and Charts. Anonymous Man Working on Reports in a Modern Office
Digital Representation of Financial Data Trends
Abstract Financial Data Over Cityscape Imagery
Abstract Digital Interface with Declining Stock Trends
Digital Security and Data Growth Concept with Holographic Padlock
Data Analysis and Graphs Displaying Stock Market Trends
Premium
Hands typing on a laptop with glowing futuristic blue graphs and charts displayed on a transparent screen, symbolizing data analysis and technology
DNA Helix in Futuristic Data Visualization with Bar and Line Graphs
Data Processing and Cityscape Fusion in Modern Business
Dynamic Financial Data Visualization with Digital Code
Premium
A high-tech environment featuring a hand interacting with a futuristic transparent touchscreen display, showcasing data analytics and digital visuals for business insights.
Futuristic Digital Network with 3D Data Visualization
Pulsing Green Digital Waveform with Futuristic Analytics Display
Financial Growth Graphs Against Urban Architecture
Futuristic Financial Data Analytics on Digital Interface
Premium
Teacher Lectures on AI with Futuristic Holographic Interface and Data Visualization. Teaching Diverse Students in a Modern Classroom. Interactive Presentation Highlights Advanced Technology Topics
Premium
Businessman using digital tablet with futuristic 2026 interface, holographic charts, infographics on blue background, concept of strategy planning
Dynamic Financial Data Display with Stock Market Trends
Financial Data Analysis with Illuminated Cityscape Backdrop
Digital Analytics Dashboard with Graph and Map in Futuristic Style
Premium
Big data and analytics support real-time insights, predictive modeling, and data-driven decisions for business intelligence and growth. Vouch
Futuristic Financial Chart Data Analysis with Blue Bar Graph
Financial Data Processing Over Digital Cityscape
Digital Interface with Financial Data Analytics and Graphs
Futuristic Financial Data Analysis with Dynamic Charts and Graphs
Innovative Stock Market Data with Candlestick Chart and Trendline
Holographic Market Chart Showing Neon Candlestick Bars and Glowing Trend Line
Stock Market Charts and QR Code Hologram Over Grid Screen
Futuristic Digital Analytics Dashboard with Chart
Premium
Blurred background of a futuristic command center designed for technology and innovation, featuring advanced workstations and ambient lighting that creates an immersive atmosphere.
Premium
Close-up of a high-tech electric vehicle dashboard featuring a digital interface, futuristic HUD graphics, and smart driving analytics.
Digital Data Analytics with Graphs and Charts Overlay
Abstract Financial Graph Overlay on Urban Map Grid Interface
Dynamic Financial Data Graphs Overlay Cityscape
Dynamic Data Visualization on Technological Grid
Premium
Data analytics and big data strategy for real-time analytics, predictive data modeling, business intelligence analytics, and data-driven decision-making in modern digital businesses. Thunk
Digital Healthcare Data Visualization with Virus Cells During Pandemic
Digital Stock Market Analysis with Futuristic Graph Overlay
Digital Finance and Data Analytics Concept Composite
Premium
Displaying overlay on dark blur, showing bar line and pie placeholders with % labels. Technology, data, analytics, interface, innovation, futurism, dashboard
Dynamic Stock Market Chart with Currency and Candlestick Graphs
Futuristic Data Visualization with Sine Wave and Digital Elements
Futuristic financial candlestick chart with glowing cyan trend line and magenta gradient
Futuristic Digital Analytics Dashboard with Globe
Premium
Businessman using digital tablet with futuristic 2026 data interface, modern infographic graphics, analytics on dark background, concept of strategy planning
Futuristic Digital Trading Chart with Neon Candlesticks
Futuristic Data Visualization with Neon Charts and Graphs
Digital Economy Visualization With Graphs and Technology Overlay
Global Financial Data and Stock Market Trends Over World Map
Premium
Futuristic Data Analytics Dashboard Interface with Hand Gestures and Transparent Tablet.
Futuristic Neon Chart in Virtual Space with Code and Candlestick Bars
Futuristic Financial Data Over Modern City Skyline
Digital Financial Data with Illuminated Market Trend Line
Dynamic Digital Interface with Stock Market Tickers
Premium
Big Data Analytics Neural Network Data Flow Visualization, AI Machine Learning, Quantum Computing, Binary Code Digital Grid, Futuristic Artificial Intelligence Technology Abstract Background
3D DNA Helix Intertwined with Financial Data Imagery
Dynamic Financial Chart with Blue and Purple Indicators
DNA Strands on Stock Chart Digital Interface
Global Data Analytics on Digital World Map Interface
Premium
Concept of AI-powered healthcare technology. Doctor uses smart digital interface to manage patient data, visualize diagnostics, and operate remote medical systems with futuristic tools.
Futuristic Digital Dashboard with Insightful Data Visualization
Abstract Financial Data with Digital Growth Curve Background
Futuristic Digital Dashboard with Analytics and HUD Interface
Digital Display of Yen Currency with Market Trader Graph
Premium
Hands typing on laptop with AI digital interface overlay, symbolizing artificial intelligence integration, big data analytics, and smart technology in daily work and personal life.
Premium
Engineer studying AI brain for data structures and predictive analytics, highlighting smart technology and machine learning for innovation and virtual intelligence. Algorithmic thinking.
Financial Market Love: Red Hearts and Economic Graph Integration
Explore More Free Stock Images