
- Home >
- Stock Photos >
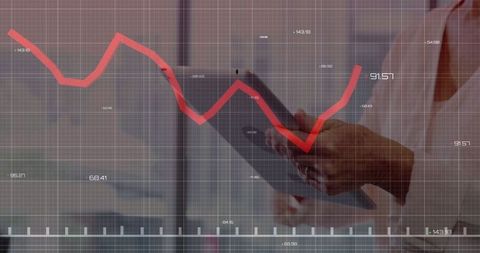
- Futuristic Analytics Interface with Wireframe Head and Trend Lines
Futuristic Analytics Interface with Wireframe Head and Trend Lines Image

Illustrates concept of advanced technology and analytics. Use for topics on innovation, data analysis, cybersecurity, and digitalization. Ideal for articles or presentations on digital futures, tech developments, or network security.
Powered by 


downloads
Tags:
More
Credit Photo
If you would like to credit the Photo, here are some ways you can do so
Text Link
photo Link
<span class="text-link">
<span>
<a target="_blank" href=https://pikwizard.com/photo/futuristic-analytics-interface-with-wireframe-head-and-trend-lines/ff31b796b0ae23bf83589d7fe2f0289c/>PikWizard</a>
</span>
</span>
<span class="image-link">
<span
style="margin: 0 0 20px 0; display: inline-block; vertical-align: middle; width: 100%;"
>
<a
target="_blank"
href="https://pikwizard.com/photo/futuristic-analytics-interface-with-wireframe-head-and-trend-lines/ff31b796b0ae23bf83589d7fe2f0289c/"
style="text-decoration: none; font-size: 10px; margin: 0;"
>
<img src="https://pikwizard.com/pw/medium/ff31b796b0ae23bf83589d7fe2f0289c.jpg" style="margin: 0; width: 100%;" alt="" />
<p style="font-size: 12px; margin: 0;">PikWizard</p>
</a>
</span>
</span>
Free (free of charge)
Free for personal and commercial use.
Author: Creative Art
Similar Free Stock Images

Premium


Premium

Premium


Premium

Premium


Premium


Premium


Premium


Premium

Premium


Premium


Premium

Premium


Premium


Premium


Premium


Premium


Premium


Premium


Premium


Premium


Premium


Premium


Premium


Premium


Explore More Free Stock Images