- Home >
- Stock Photos >
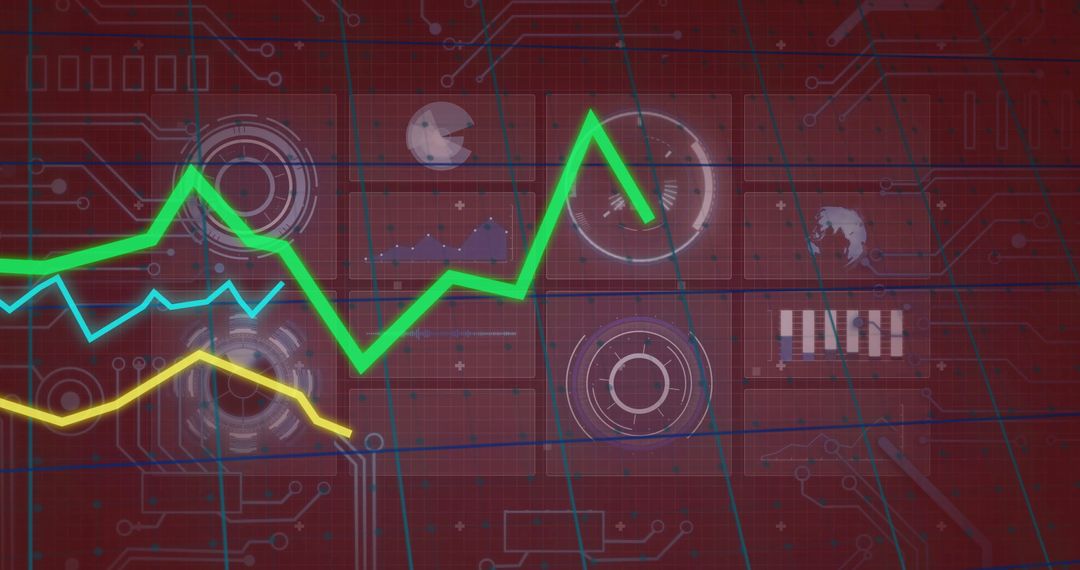
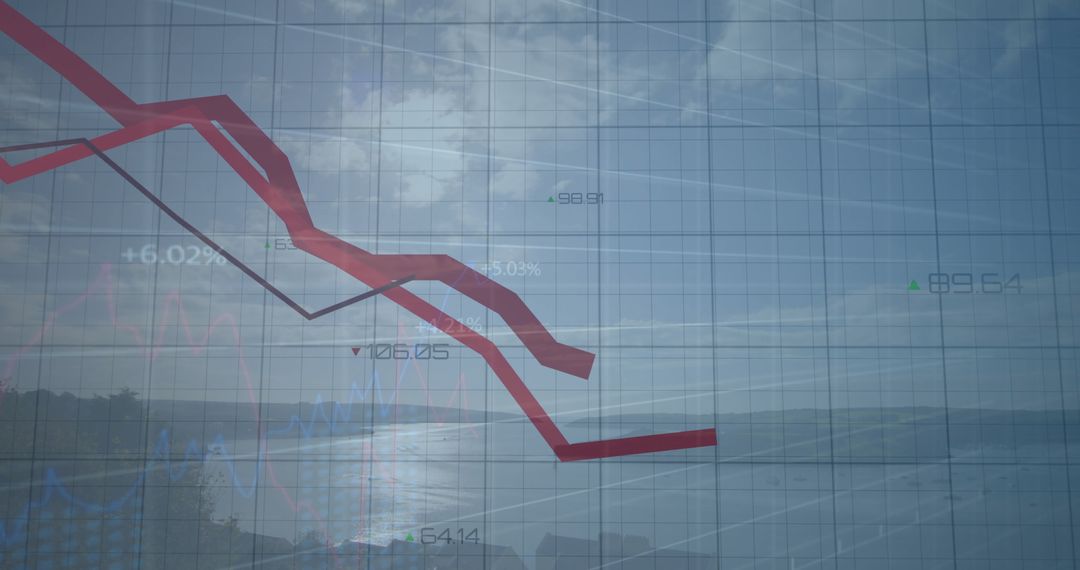
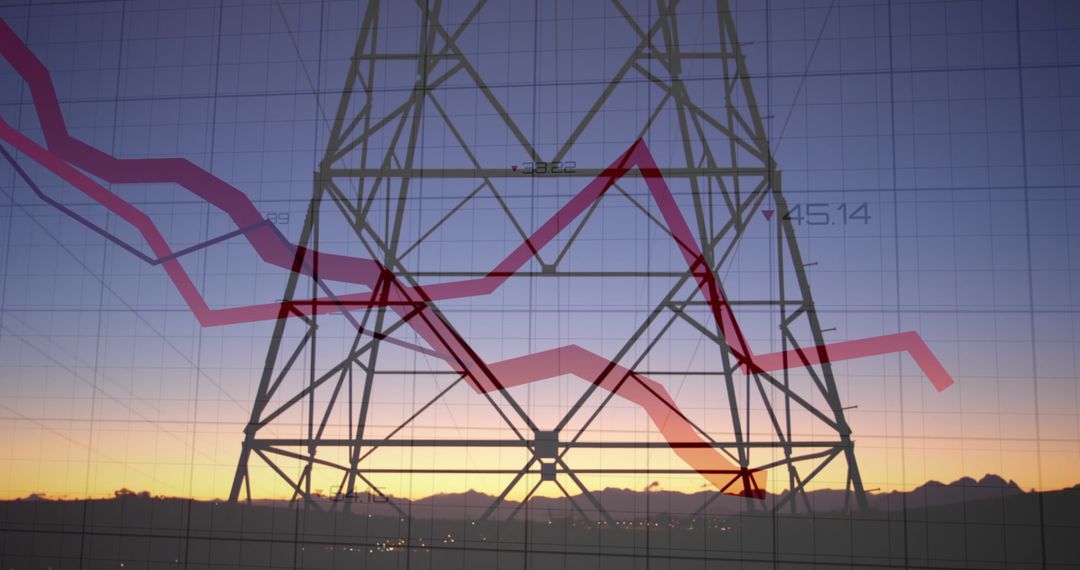
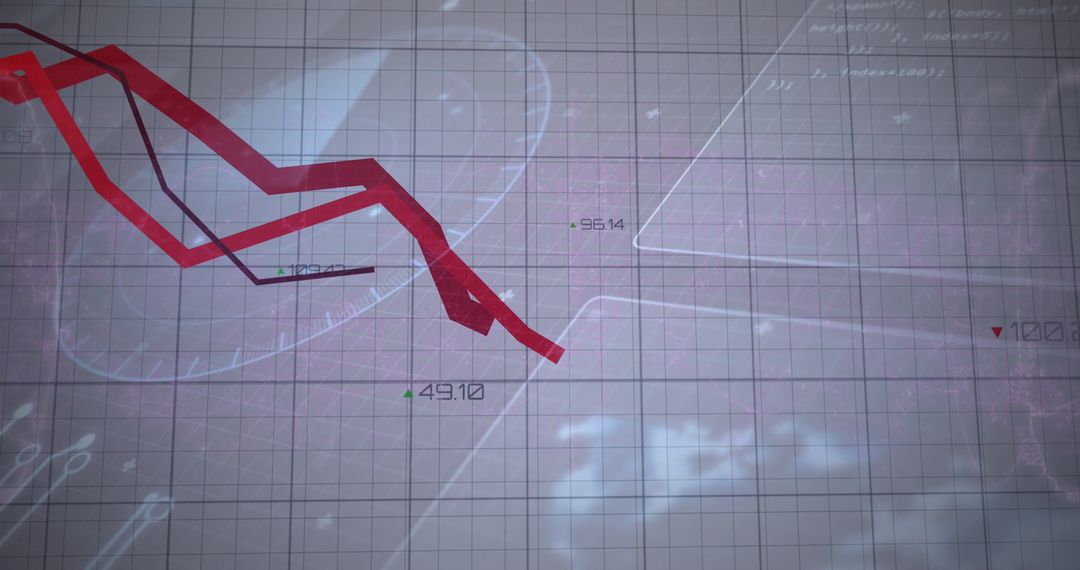
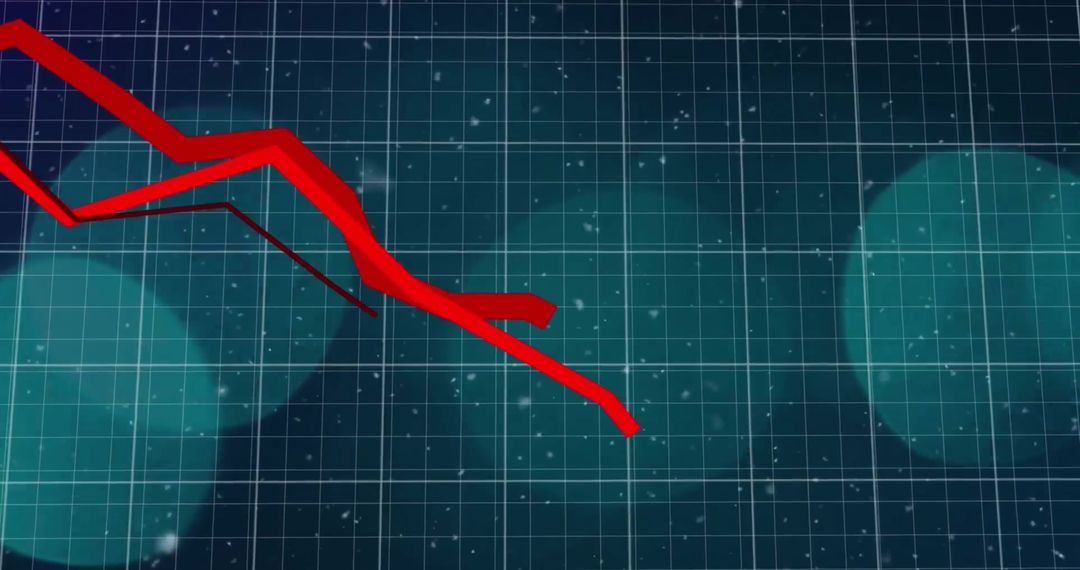
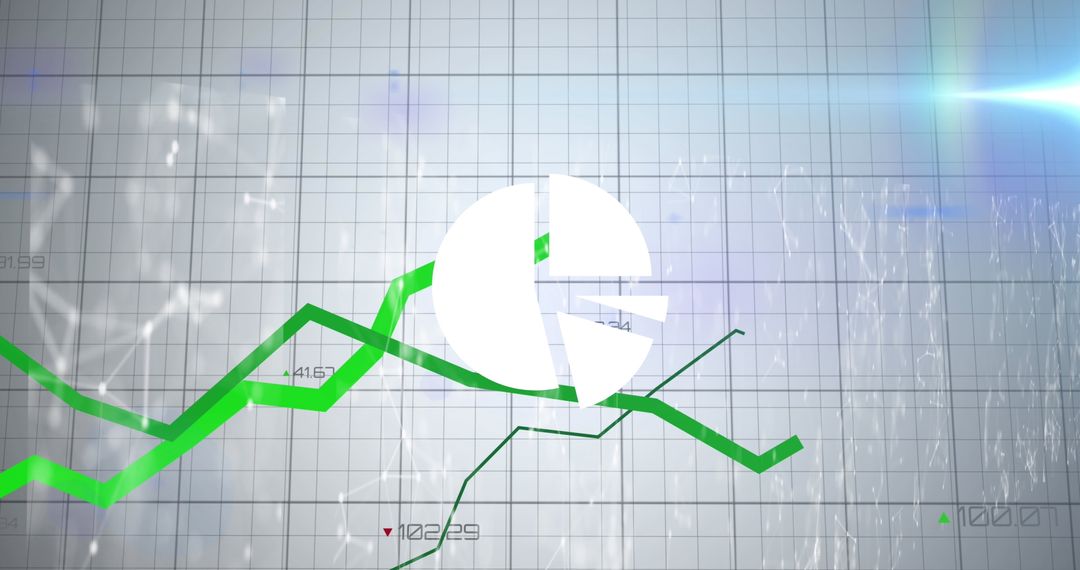
- Futuristic Analytics with Descending Graph and Lens Flare
Futuristic Analytics with Descending Graph and Lens Flare Image
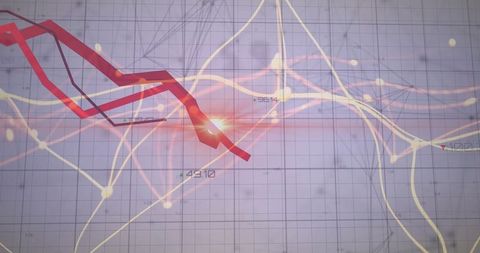
Ideal for illustrating concepts in data analytics, digital finance trends, or technology innovation. Suitable for use in presentations, blogs, and websites focused on financial analysis or technological advancements.
Powered by 


0
downloads
downloads
Tags:
More
Credit Photo
If you would like to credit the Photo, here are some ways you can do so
Text Link
photo Link
<span class="text-link">
<span>
<a target="_blank" href=https://pikwizard.com/photo/futuristic-analytics-with-descending-graph-and-lens-flare/700edac74f6c412ba388b1dd892ae69a/>PikWizard</a>
</span>
</span>
<span class="image-link">
<span
style="margin: 0 0 20px 0; display: inline-block; vertical-align: middle; width: 100%;"
>
<a
target="_blank"
href="https://pikwizard.com/photo/futuristic-analytics-with-descending-graph-and-lens-flare/700edac74f6c412ba388b1dd892ae69a/"
style="text-decoration: none; font-size: 10px; margin: 0;"
>
<img src="https://pikwizard.com/pw/medium/700edac74f6c412ba388b1dd892ae69a.jpg" style="margin: 0; width: 100%;" alt="" />
<p style="font-size: 12px; margin: 0;">PikWizard</p>
</a>
</span>
</span>
Free (free of charge)
Free for personal and commercial use.
Author: Creative Art
Similar Free Stock Images

Premium


Premium


Premium


Premium


Premium


Premium


Premium


Premium


Premium