
- Home >
- Stock Photos >
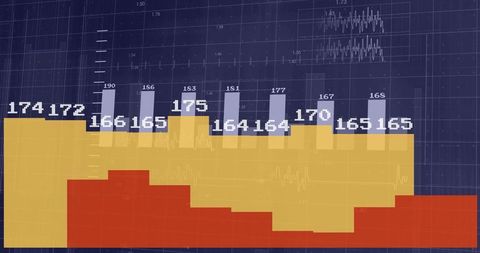
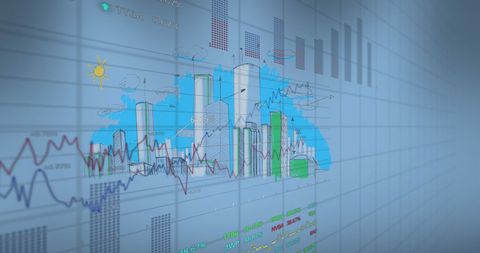
- Futuristic Bar Chart Visualization in Digital Interface
Futuristic Bar Chart Visualization in Digital Interface Image
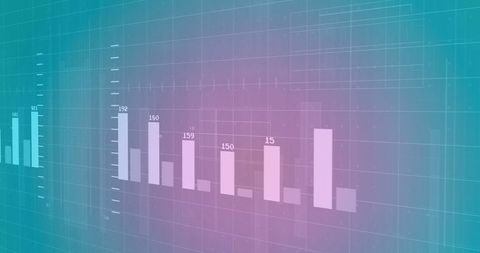
Visual representation of data using bar charts with digital effects, suitable for illustrating data analytics or technology themes in reports or presentations. Ideal for depicting trends and making analytical forecasts in various fields.
Powered by  - Get 15% off with code: PIKWIZARD15


downloads
Tags:
More
Credit Photo
If you would like to credit the Photo, here are some ways you can do so
Text Link
photo Link
<span class="text-link">
<span>
<a target="_blank" href=https://pikwizard.com/photo/futuristic-bar-chart-visualization-in-digital-interface/94766b7c1bf7e9194da1cd1eec57dab0/>PikWizard</a>
</span>
</span>
<span class="image-link">
<span
style="margin: 0 0 20px 0; display: inline-block; vertical-align: middle; width: 100%;"
>
<a
target="_blank"
href="https://pikwizard.com/photo/futuristic-bar-chart-visualization-in-digital-interface/94766b7c1bf7e9194da1cd1eec57dab0/"
style="text-decoration: none; font-size: 10px; margin: 0;"
>
<img src="https://pikwizard.com/pw/medium/94766b7c1bf7e9194da1cd1eec57dab0.jpg" style="margin: 0; width: 100%;" alt="" />
<p style="font-size: 12px; margin: 0;">PikWizard</p>
</a>
</span>
</span>
Free (free of charge)
Free for personal and commercial use.
Author: Authentic Images
Similar Free Stock Images

Premium

Premium


Premium


Premium

Premium

Premium


Premium


Premium


Premium

Premium


Premium


Premium

Premium

Premium


Premium


Premium

Premium


Premium


Premium


Premium


Premium

Premium


Premium


Premium


Premium

Explore More Free Stock Images