- Home >
- Stock Photos >
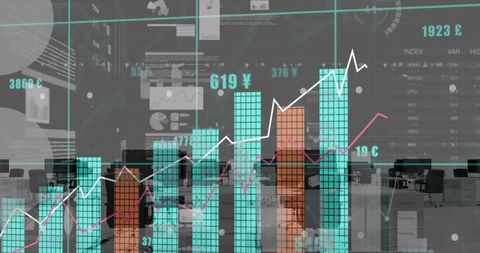
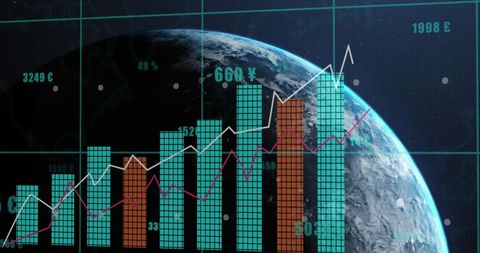
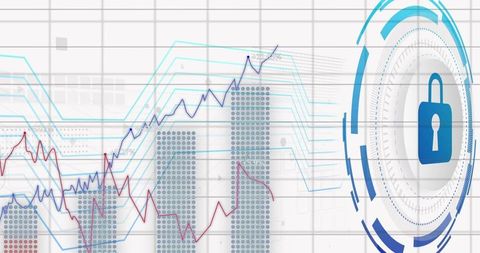
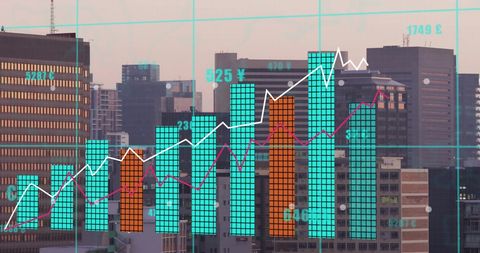
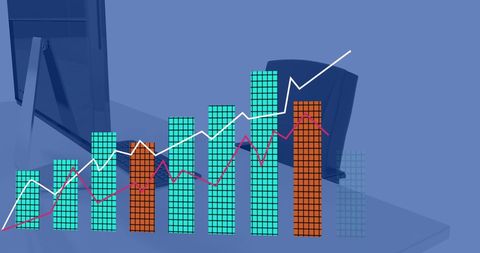
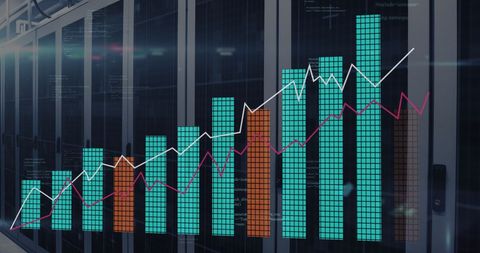
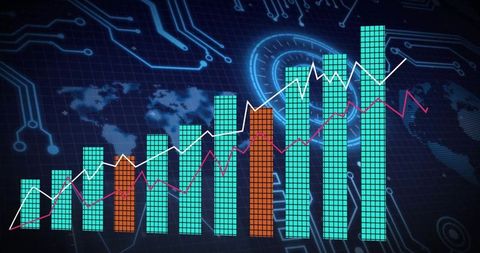
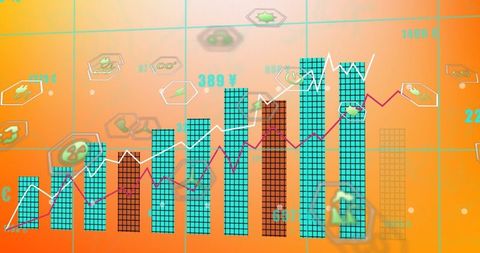
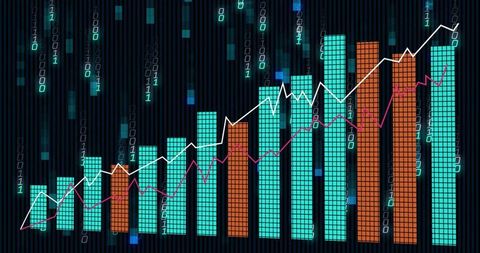
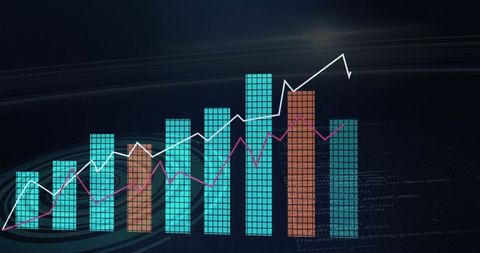
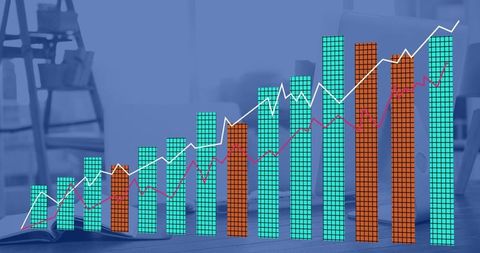
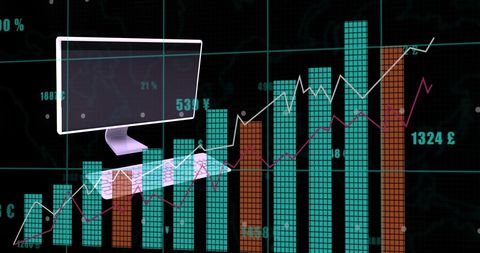
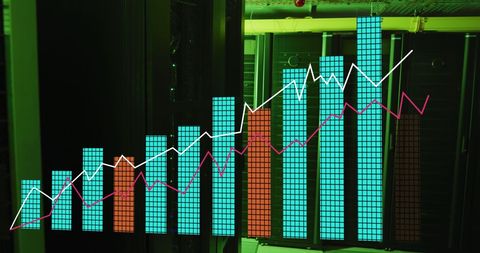
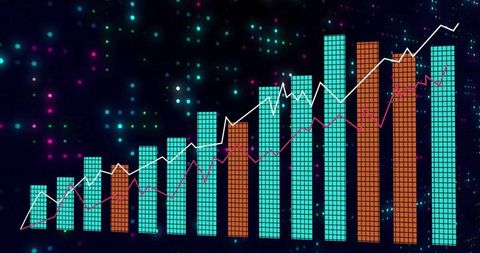
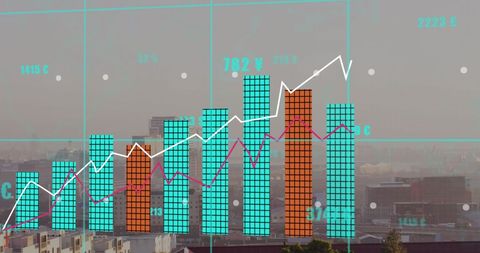
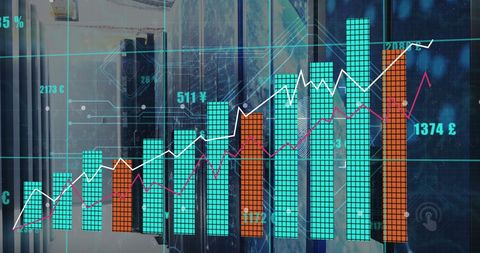
- Futuristic Bar Chart with Trend Lines on Digital Interface
Futuristic Bar Chart with Trend Lines on Digital Interface Image
Visually gripping representation of data trends using bar charts and lines in digital interface, showcasing growth and performance. Ideal for use in publications related to finance, business analytics, technology or digital innovation. Suitable for presentations, educational materials or blogs discussing data-driven decisions.

downloads
Tags:
More
Credit Photo
If you would like to credit the Photo, here are some ways you can do so
Text Link
photo Link
<span class="text-link">
<span>
<a target="_blank" href=https://pikwizard.com/photo/futuristic-bar-chart-with-trend-lines-on-digital-interface/efea039e26800ac4fffcd885489a1b0f/>PikWizard</a>
</span>
</span>
<span class="image-link">
<span
style="margin: 0 0 20px 0; display: inline-block; vertical-align: middle; width: 100%;"
>
<a
target="_blank"
href="https://pikwizard.com/photo/futuristic-bar-chart-with-trend-lines-on-digital-interface/efea039e26800ac4fffcd885489a1b0f/"
style="text-decoration: none; font-size: 10px; margin: 0;"
>
<img src="https://pikwizard.com/pw/medium/efea039e26800ac4fffcd885489a1b0f.jpg" style="margin: 0; width: 100%;" alt="" />
<p style="font-size: 12px; margin: 0;">PikWizard</p>
</a>
</span>
</span>
Free (free of charge)
Free for personal and commercial use.
Author: Creative Art