- Home >
- Stock Photos >
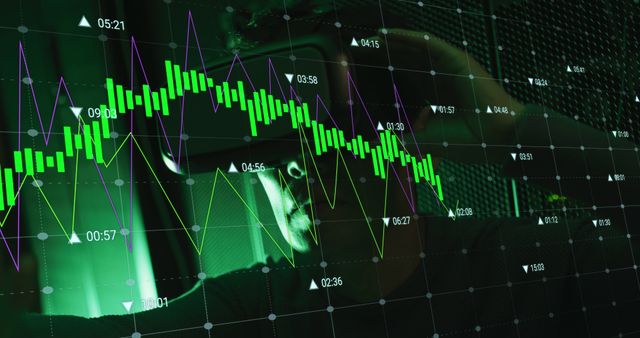
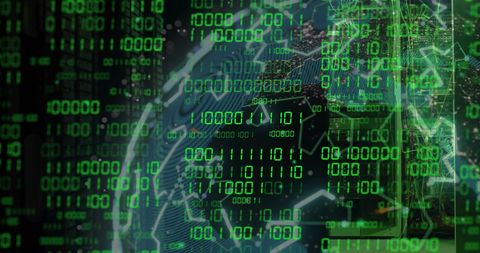
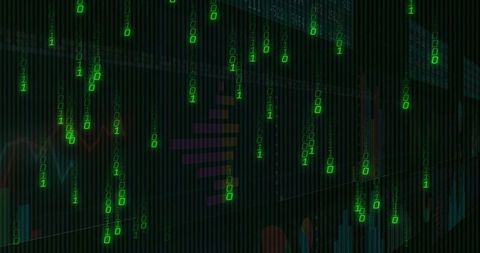
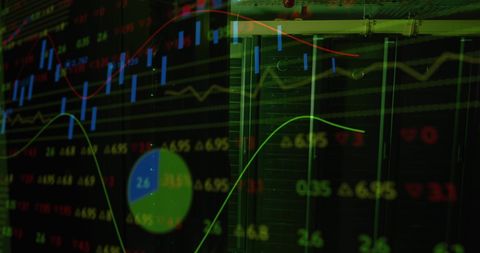
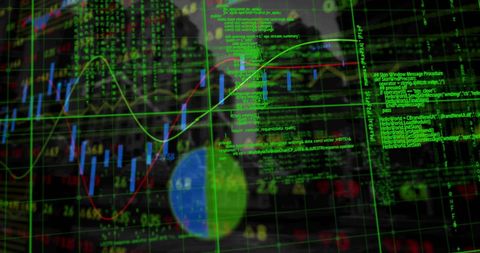
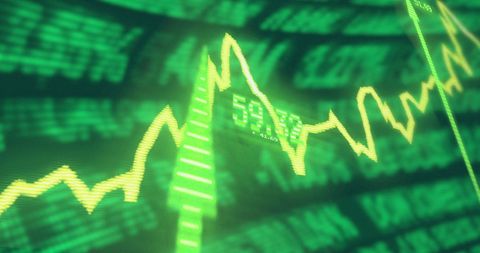
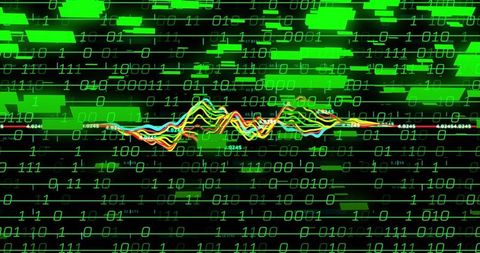
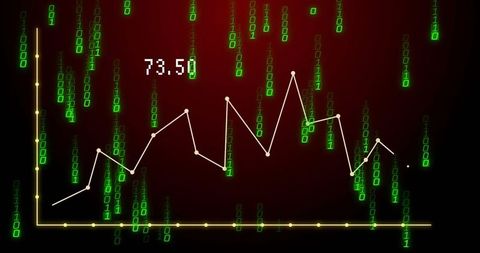
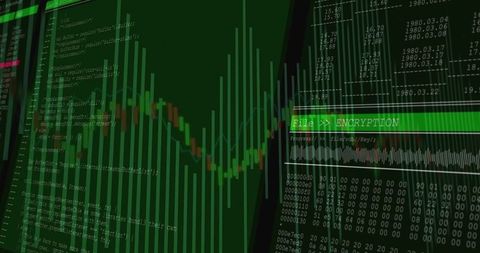
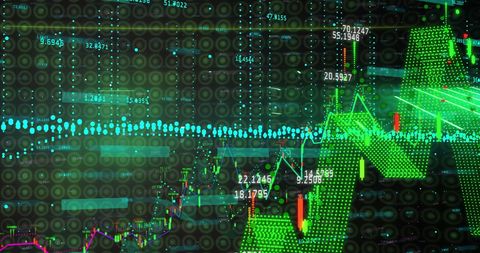
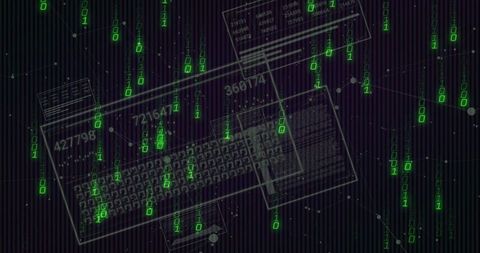
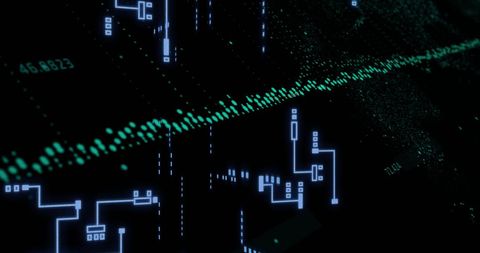
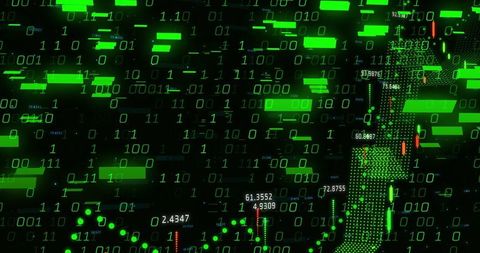
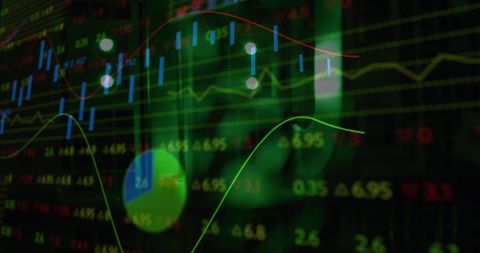
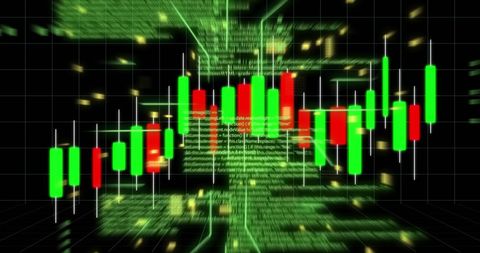
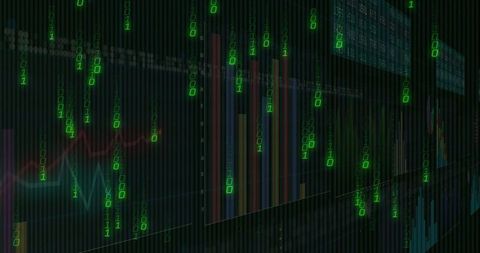
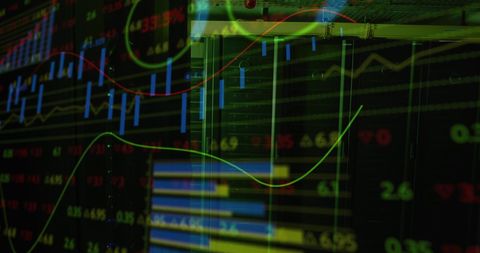
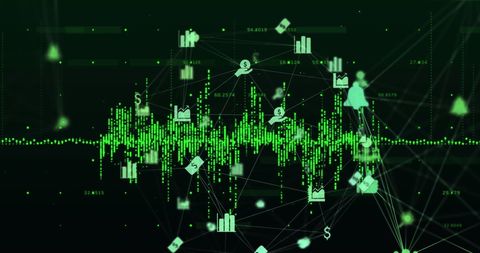
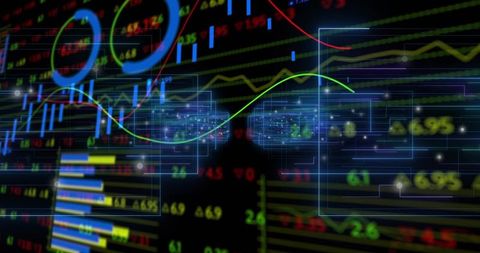
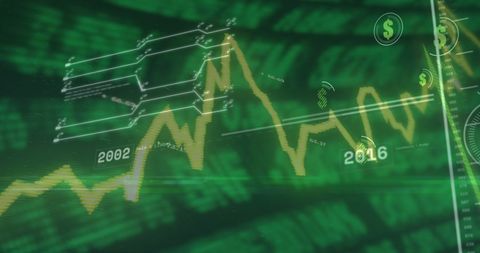
- Futuristic Binary Data with Candlestick Chart Analysis
Futuristic Binary Data with Candlestick Chart Analysis Image
Visualization of candlestick chart over binary code background highlights intersection of finance and modern technology. Perfect for illustrating concepts in digital finance, trading analytics, and advanced data visualization techniques. Useful for financial applications, technology features, or trading platforms representation appealing to tech-savvy finance professionals.

downloads
Tags:
More
Credit Photo
If you would like to credit the Photo, here are some ways you can do so
Text Link
photo Link
<span class="text-link">
<span>
<a target="_blank" href=https://pikwizard.com/photo/futuristic-binary-data-with-candlestick-chart-analysis/41605bc20287f80d8333caf09af6e66f/>PikWizard</a>
</span>
</span>
<span class="image-link">
<span
style="margin: 0 0 20px 0; display: inline-block; vertical-align: middle; width: 100%;"
>
<a
target="_blank"
href="https://pikwizard.com/photo/futuristic-binary-data-with-candlestick-chart-analysis/41605bc20287f80d8333caf09af6e66f/"
style="text-decoration: none; font-size: 10px; margin: 0;"
>
<img src="https://pikwizard.com/pw/medium/41605bc20287f80d8333caf09af6e66f.jpg" style="margin: 0; width: 100%;" alt="" />
<p style="font-size: 12px; margin: 0;">PikWizard</p>
</a>
</span>
</span>
Free (free of charge)
Free for personal and commercial use.
Author: Authentic Images