- Home >
- Stock Photos >
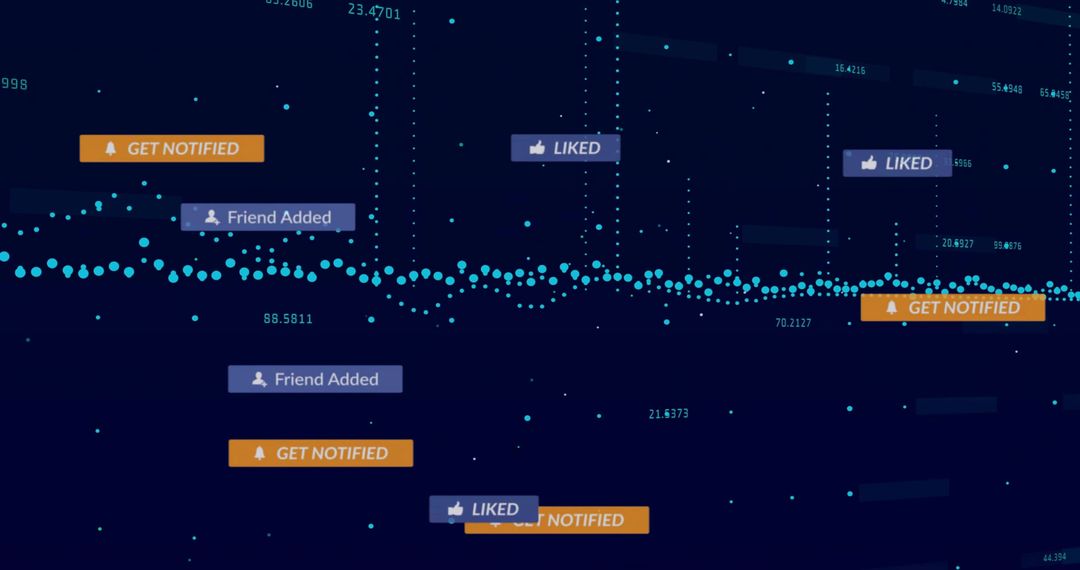
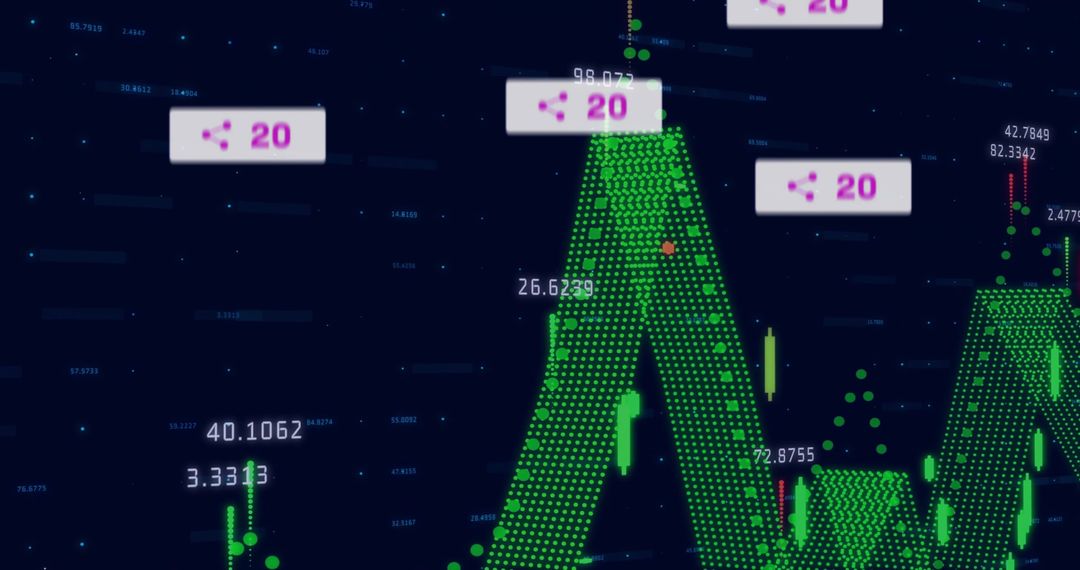
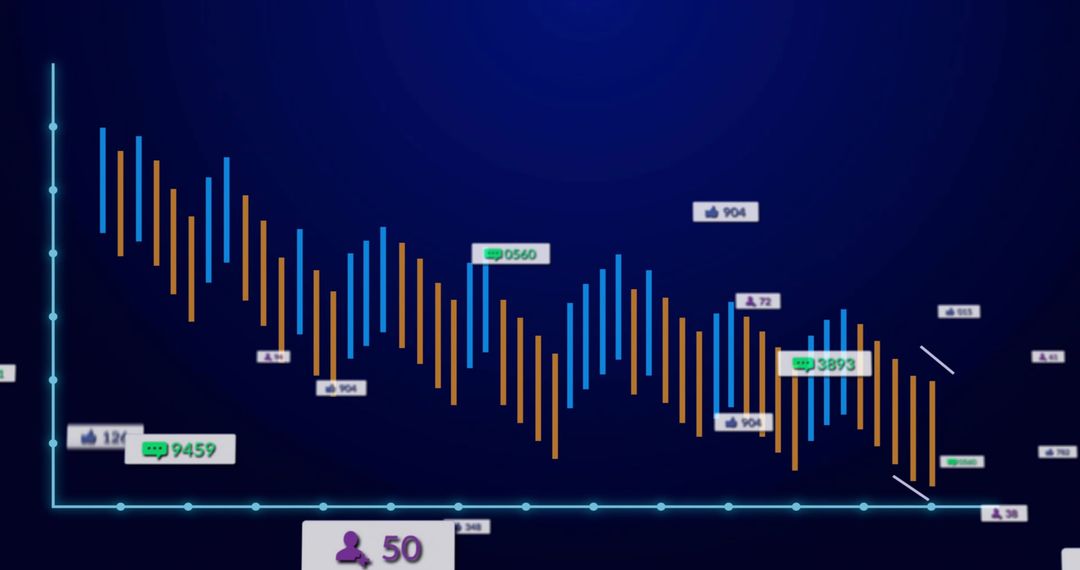
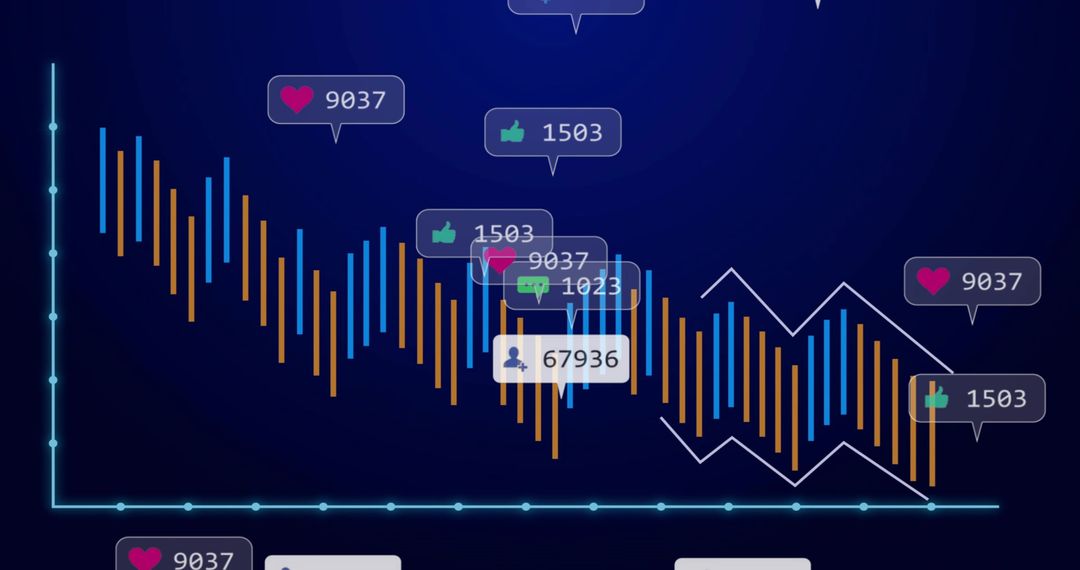
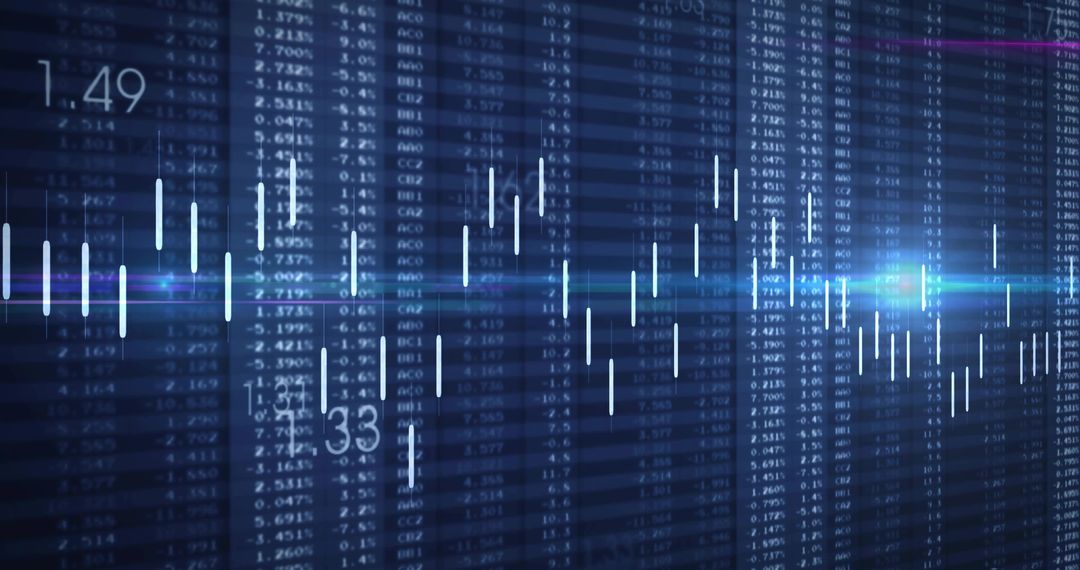
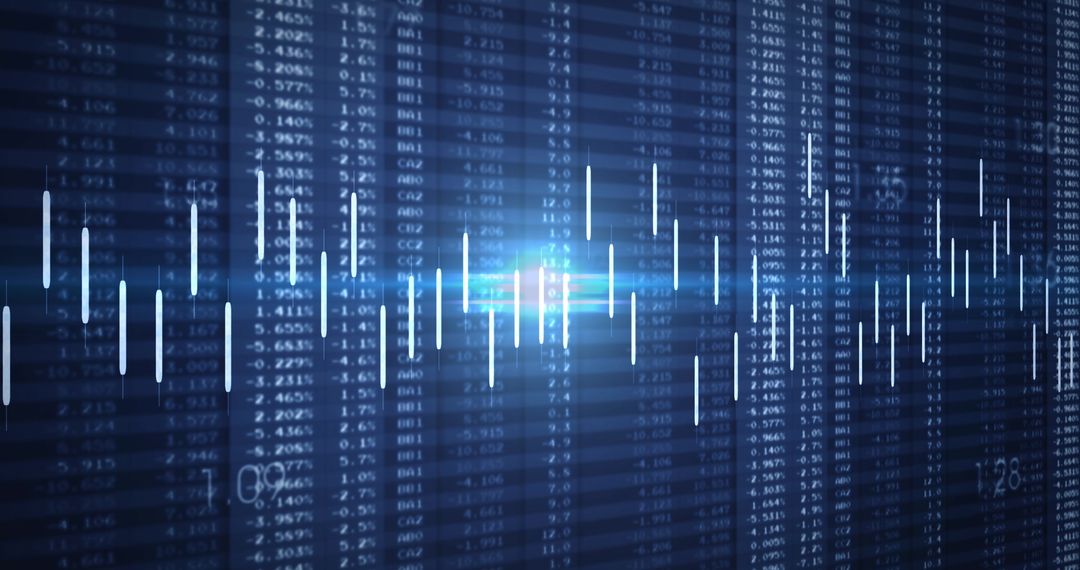
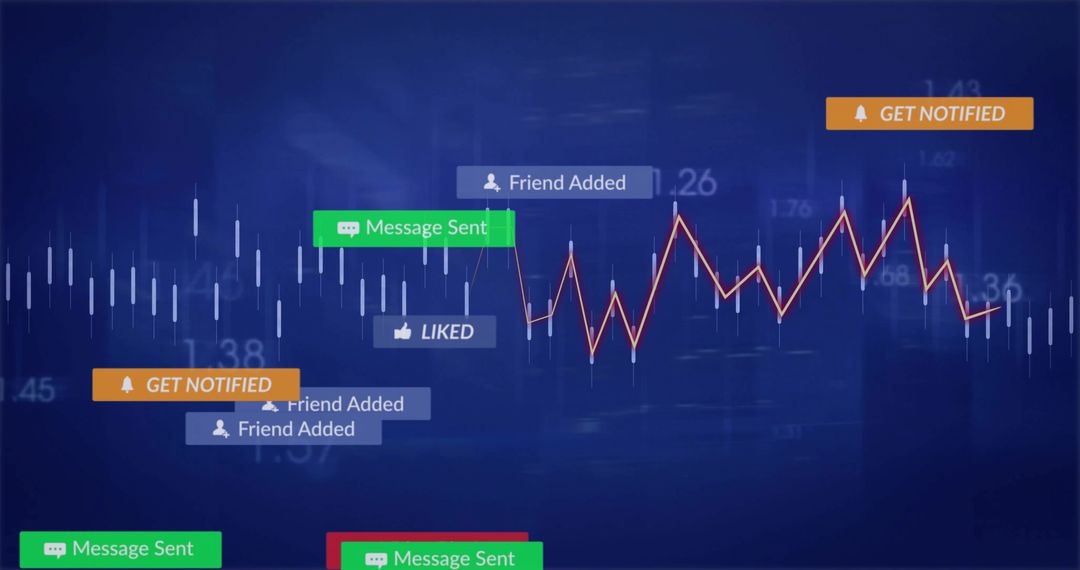
- Futuristic Blue Candlestick Trading Dashboard with Social Notifications and Analytics
Futuristic Blue Candlestick Trading Dashboard with Social Notifications and Analytics Image
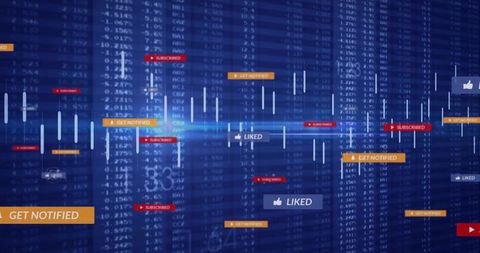
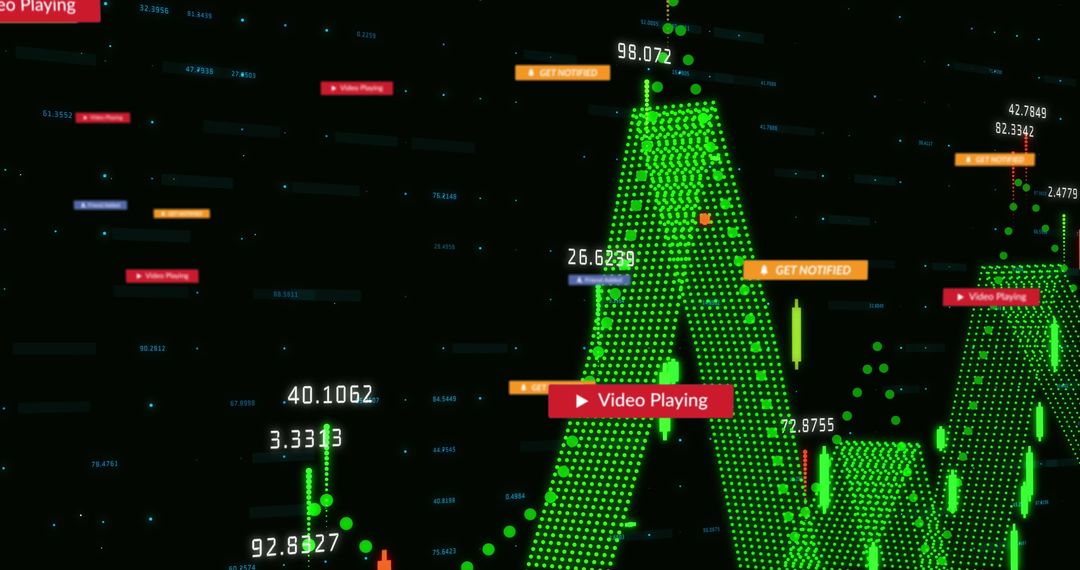
Showing neon blue candlestick chart overlaid with social engagement labels like SUBSCRIBED, GET NOTIFIED, LIKED. Featuring numeric market data columns, floating data points, and subtle motion blur for dynamic, futuristic look. Working well for fintech websites, trading platforms, financial newsletters, investment presentations, app UI mockups, social media posts promoting market analysis or trading signals. Serving as hero banner, landing page header, blog cover, webinar graphic, video thumbnail, presentation slide background. Pairing with bold headlines, data-driven infographics, and CTA overlays to highlight engagement metrics or product features. Color palette supporting overlay text and iconography for high visibility.
Powered by  - Get 15% off with code: PIKWIZARD15


0
downloads
downloads
Tags:
More
Credit Photo
If you would like to credit the Photo, here are some ways you can do so
Text Link
photo Link
<span class="text-link">
<span>
<a target="_blank" href=https://pikwizard.com/photo/futuristic-blue-candlestick-trading-dashboard-with-social-notifications-and-analytics/70b628bcd3eaf52db5213f765ec1a4a4/>PikWizard</a>
</span>
</span>
<span class="image-link">
<span
style="margin: 0 0 20px 0; display: inline-block; vertical-align: middle; width: 100%;"
>
<a
target="_blank"
href="https://pikwizard.com/photo/futuristic-blue-candlestick-trading-dashboard-with-social-notifications-and-analytics/70b628bcd3eaf52db5213f765ec1a4a4/"
style="text-decoration: none; font-size: 10px; margin: 0;"
>
<img src="https://pikwizard.com/pw/medium/70b628bcd3eaf52db5213f765ec1a4a4.jpg" style="margin: 0; width: 100%;" alt="" />
<p style="font-size: 12px; margin: 0;">PikWizard</p>
</a>
</span>
</span>
Free (free of charge)
Free for personal and commercial use.
Author: Authentic Images
Similar Free Stock Images
Premium


Premium


Premium


Premium


Premium


Premium


Premium


Premium


Premium


Premium


Premium


Premium


Premium


Premium


Premium


Premium


Premium


Premium


Premium


Premium


Premium


Premium


Premium


Premium