- Home >
- Stock Photos >
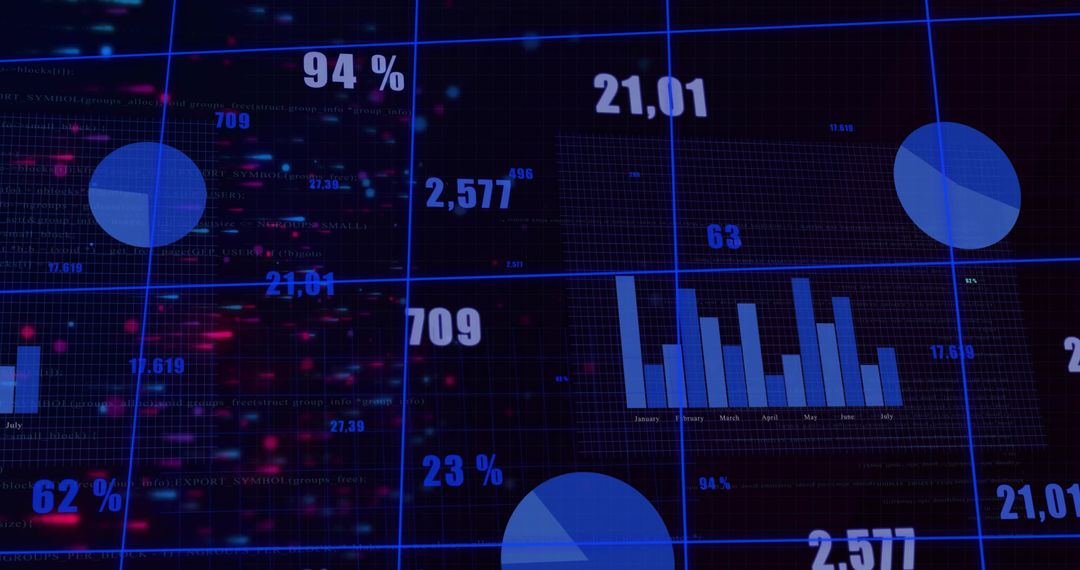
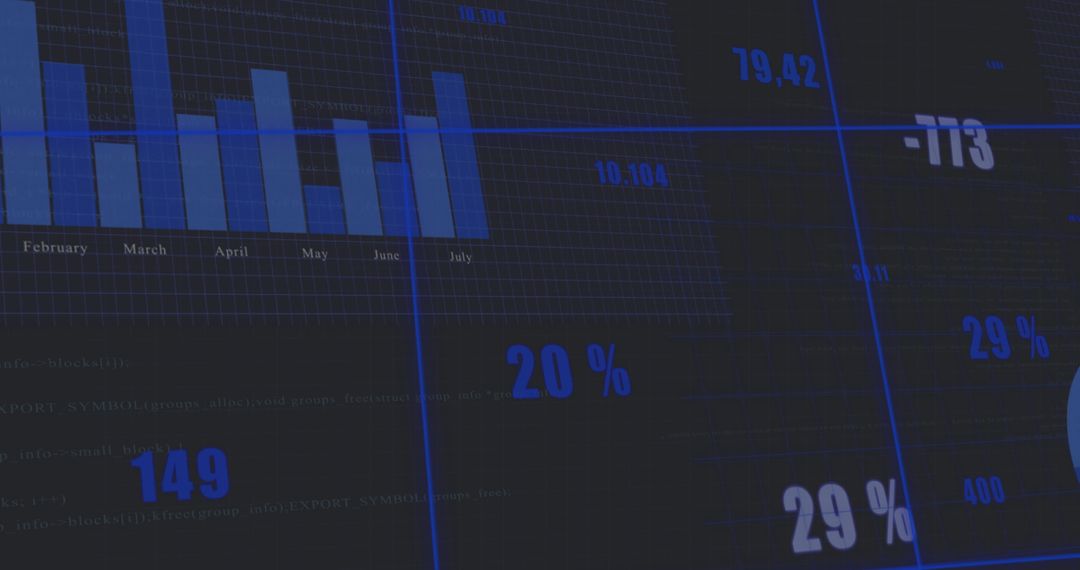
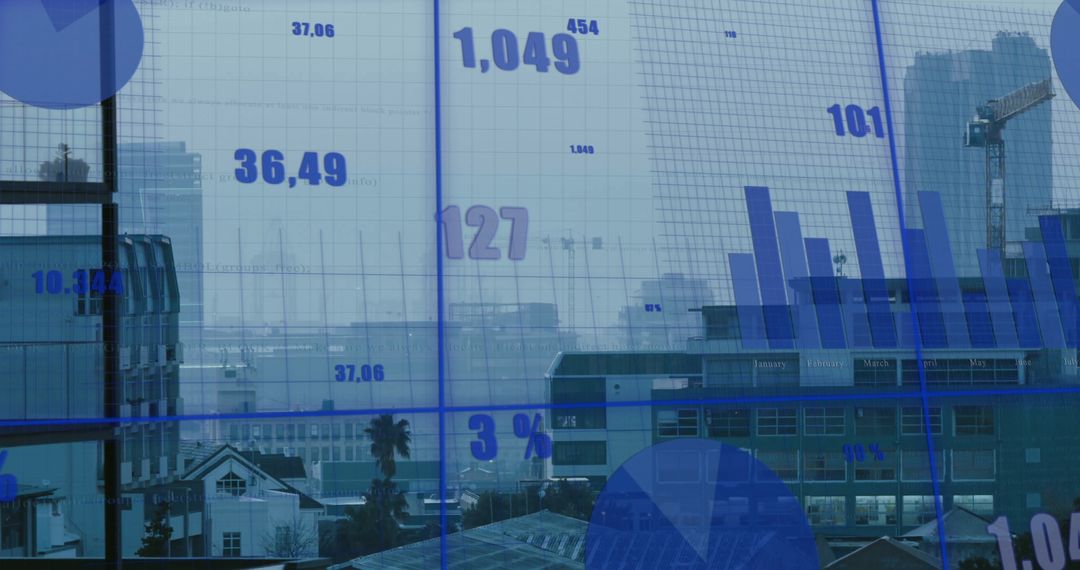
- Futuristic Blue Data Dashboard Displaying Bar Chart and Percentage Metrics
Futuristic Blue Data Dashboard Displaying Bar Chart and Percentage Metrics Image

High-tech blue dashboard displaying bar chart, 20 percent and 29 percent percentage readouts, gridlines, and numeric overlays. Ideal for presenting analytics, financial results, KPI tracking, performance reporting, and technology branding. Working well for website headers, slide decks, marketing campaigns, investor reports, app mockups, and social media visuals. Allowing easy overlay of headlines, logos, and custom data for quick customization and reuse.
Powered by  - Get 15% off with code: PIKWIZARD15


0
downloads
downloads
Tags:
More
Credit Photo
If you would like to credit the Photo, here are some ways you can do so
Text Link
photo Link
<span class="text-link">
<span>
<a target="_blank" href=https://pikwizard.com/photo/futuristic-blue-data-dashboard-displaying-bar-chart-and-percentage-metrics/143b17f100b55227a1d7578e68e26509/>PikWizard</a>
</span>
</span>
<span class="image-link">
<span
style="margin: 0 0 20px 0; display: inline-block; vertical-align: middle; width: 100%;"
>
<a
target="_blank"
href="https://pikwizard.com/photo/futuristic-blue-data-dashboard-displaying-bar-chart-and-percentage-metrics/143b17f100b55227a1d7578e68e26509/"
style="text-decoration: none; font-size: 10px; margin: 0;"
>
<img src="https://pikwizard.com/pw/medium/143b17f100b55227a1d7578e68e26509.jpg" style="margin: 0; width: 100%;" alt="" />
<p style="font-size: 12px; margin: 0;">PikWizard</p>
</a>
</span>
</span>
Free (free of charge)
Free for personal and commercial use.
Author: Awesome Content
Similar Free Stock Images

Premium


Premium


Premium


Premium


Premium


Premium


Premium


Premium


Premium


Premium


Premium


Premium


Premium


Premium


Premium


Premium


Premium


Premium


Premium


Premium


Premium


Premium


Premium


Premium