- Home >
- Stock Photos >
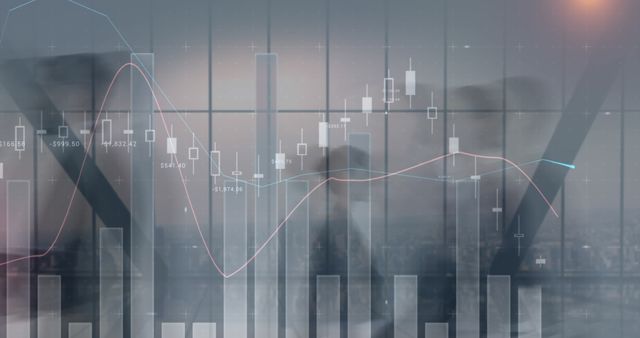
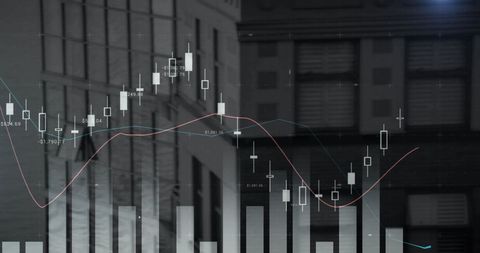
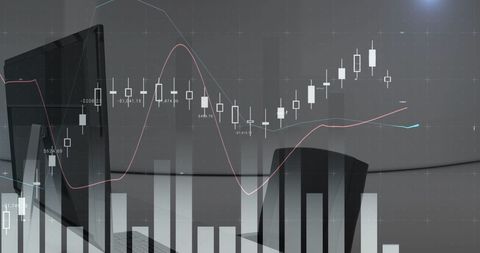
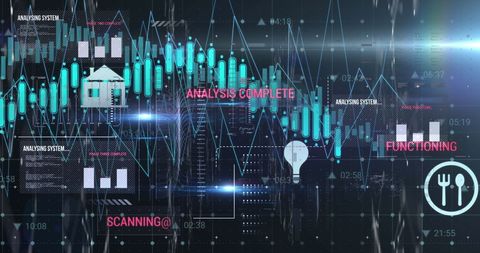
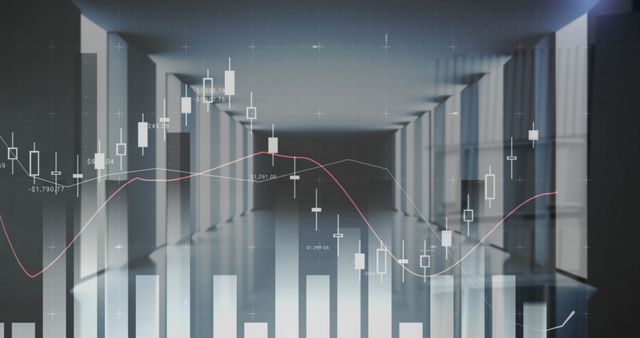
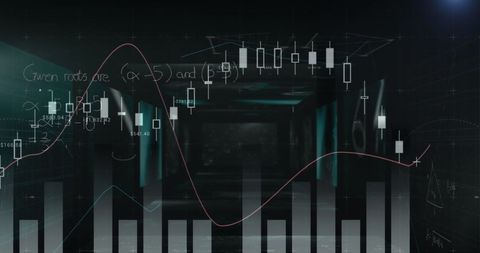
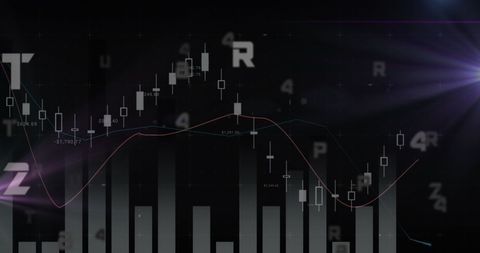
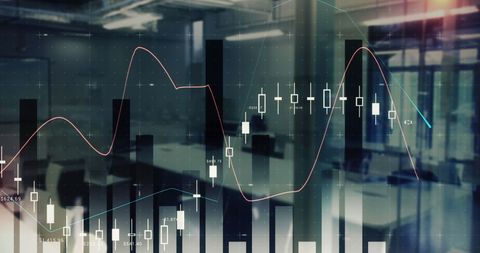
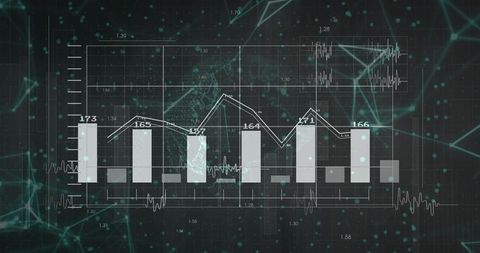
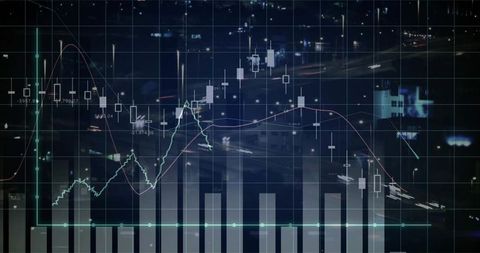
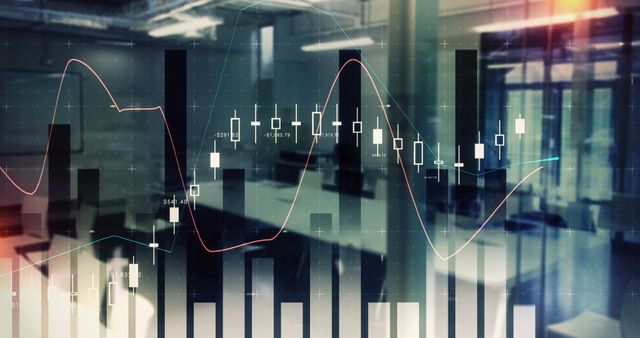
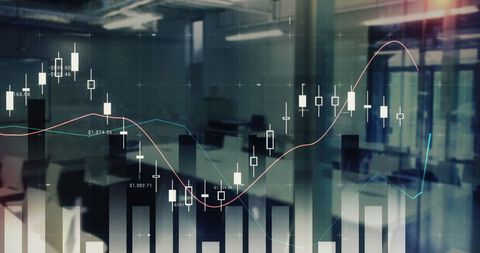
- Futuristic Business Analytics and Mathematical Models
Futuristic Business Analytics and Mathematical Models Image
Stylized visualization depicting integration of mathematical models with data analysis in a tech-driven environment. Suitable for illustrating concepts in business analytics, technology advancements, scientific research, and educational materials related to data science.

downloads
Tags:
More
Credit Photo
If you would like to credit the Photo, here are some ways you can do so
Text Link
photo Link
<span class="text-link">
<span>
<a target="_blank" href=https://pikwizard.com/photo/futuristic-business-analytics-and-mathematical-models/cf8dea3e93e1a144b9b8f68623efa2a2/>PikWizard</a>
</span>
</span>
<span class="image-link">
<span
style="margin: 0 0 20px 0; display: inline-block; vertical-align: middle; width: 100%;"
>
<a
target="_blank"
href="https://pikwizard.com/photo/futuristic-business-analytics-and-mathematical-models/cf8dea3e93e1a144b9b8f68623efa2a2/"
style="text-decoration: none; font-size: 10px; margin: 0;"
>
<img src="https://pikwizard.com/pw/medium/cf8dea3e93e1a144b9b8f68623efa2a2.jpg" style="margin: 0; width: 100%;" alt="" />
<p style="font-size: 12px; margin: 0;">PikWizard</p>
</a>
</span>
</span>
Free (free of charge)
Free for personal and commercial use.
Author: People Creations