
- Home >
- Stock Photos >
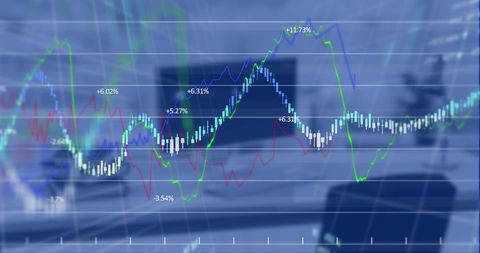
- Futuristic Business Data Analytics with Graph
Futuristic Business Data Analytics with Graph Image

Blurred modern office as backdrop highlights central transparent screen with graph, providing cutting-edge analytics visualization. Ideal for themes including business strategy, market research, financial reports or presentations on growth and technical advancements.
Powered by 


downloads
Tags:
More
Credit Photo
If you would like to credit the Photo, here are some ways you can do so
Text Link
photo Link
<span class="text-link">
<span>
<a target="_blank" href=https://pikwizard.com/photo/futuristic-business-data-analytics-with-graph/bc25e56ddc77f300e1c27fefd0a09662/>PikWizard</a>
</span>
</span>
<span class="image-link">
<span
style="margin: 0 0 20px 0; display: inline-block; vertical-align: middle; width: 100%;"
>
<a
target="_blank"
href="https://pikwizard.com/photo/futuristic-business-data-analytics-with-graph/bc25e56ddc77f300e1c27fefd0a09662/"
style="text-decoration: none; font-size: 10px; margin: 0;"
>
<img src="https://pikwizard.com/pw/medium/bc25e56ddc77f300e1c27fefd0a09662.jpg" style="margin: 0; width: 100%;" alt="" />
<p style="font-size: 12px; margin: 0;">PikWizard</p>
</a>
</span>
</span>
Free (free of charge)
Free for personal and commercial use.
Author: Authentic Images
Similar Free Stock Images

Premium


Premium

Premium


Premium


Premium


Premium


Premium


Premium

Premium


Premium


Premium


Premium


Premium


Premium


Premium

Premium


Premium

Premium


Premium


Premium


Premium

Premium


Premium

Premium


Premium


Explore More Free Stock Images