- Home >
- Stock Photos >
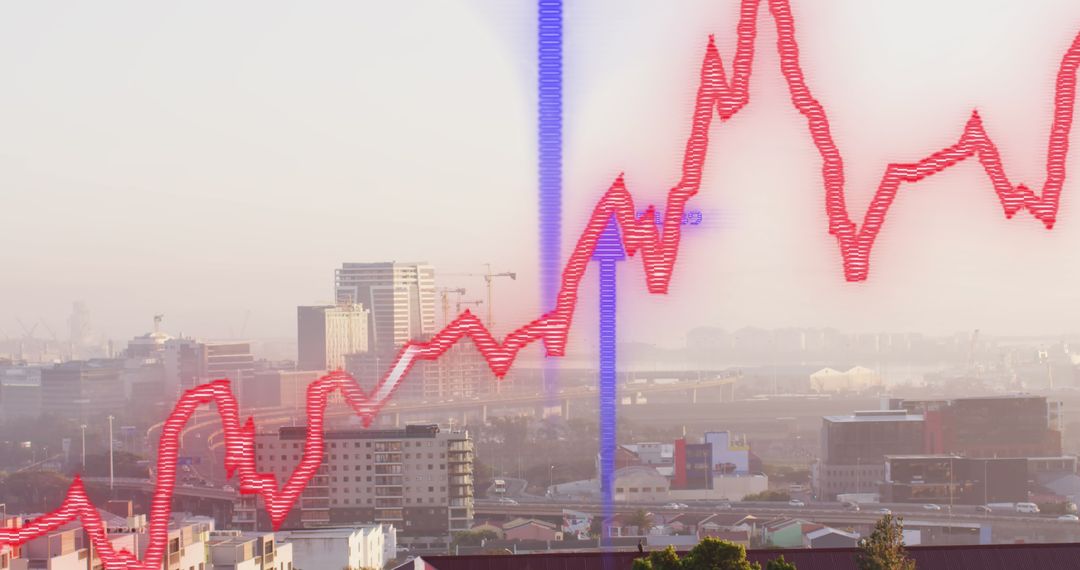
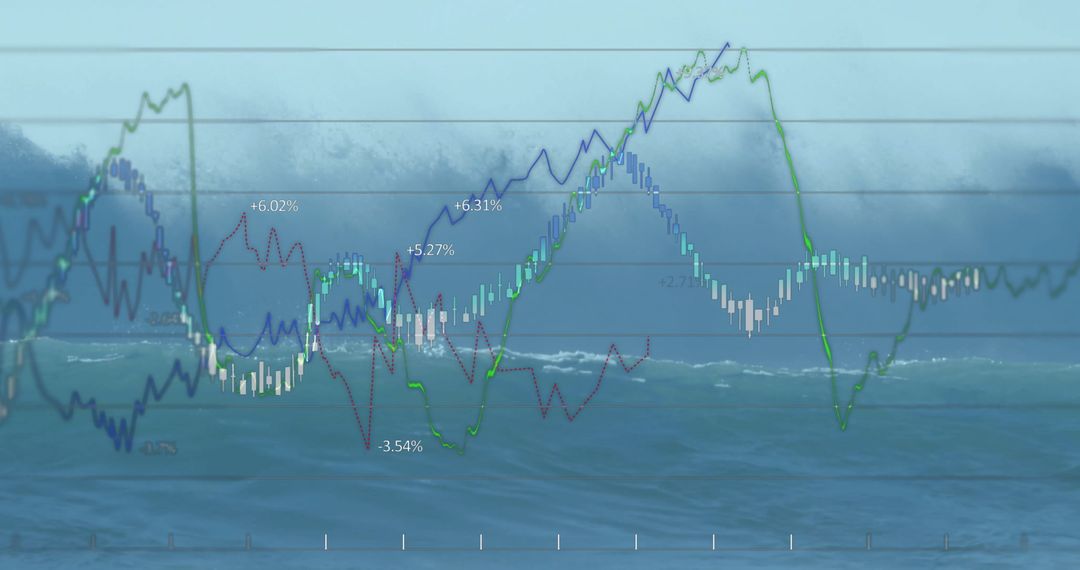
- Futuristic Business Data Graphs over City Skyline
Futuristic Business Data Graphs over City Skyline Image

Dynamic visualization of data graphs overlaying a cityscape. Represents themes of advanced analytics, digital communication, and business innovation. Useful for business presentations, tech company brochures, and articles on financial strategies.
Powered by 


2
downloads
downloads
Credit Photo
If you would like to credit the Photo, here are some ways you can do so
Text Link
photo Link
<span class="text-link">
<span>
<a target="_blank" href=https://pikwizard.com/photo/futuristic-business-data-graphs-over-city-skyline/4f906b8500d0876079c066a21e68a57b/>PikWizard</a>
</span>
</span>
<span class="image-link">
<span
style="margin: 0 0 20px 0; display: inline-block; vertical-align: middle; width: 100%;"
>
<a
target="_blank"
href="https://pikwizard.com/photo/futuristic-business-data-graphs-over-city-skyline/4f906b8500d0876079c066a21e68a57b/"
style="text-decoration: none; font-size: 10px; margin: 0;"
>
<img src="https://pikwizard.com/pw/medium/4f906b8500d0876079c066a21e68a57b.jpg" style="margin: 0; width: 100%;" alt="" />
<p style="font-size: 12px; margin: 0;">PikWizard</p>
</a>
</span>
</span>
Free (free of charge)
Free for personal and commercial use.
Author: People Creations
Similar Free Stock Images

Premium


Premium


Premium


Premium


Premium


Premium


Premium


Premium


Premium


Premium


Premium


Premium


Premium


Premium


Premium


Premium


Premium


Premium


Premium


Premium


Premium


Premium


Premium


Premium